“Data Admin”
Add new asset (e.g. observation well)
With the Data Admin application, you can add new assets to MIKE Mine. This could for example be a newly drilled observation well. This guide will explain the necessary steps to add a new asset to MIKE Mine.
| Instruction | Screen |
|---|---|
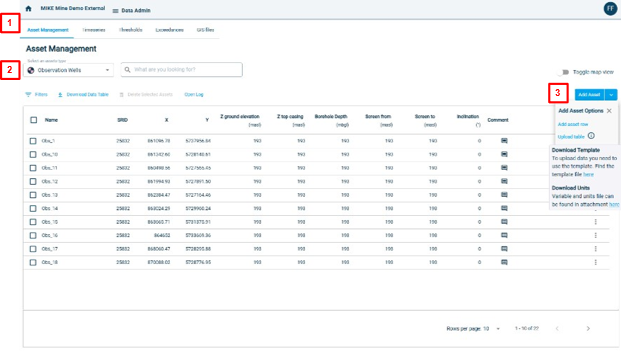
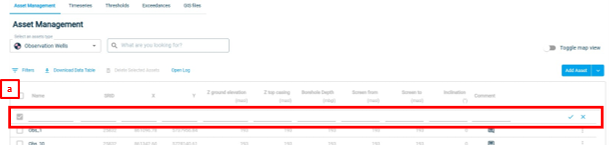
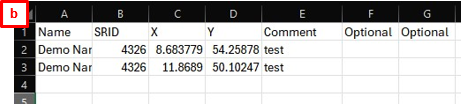
| 1. Open the Data Admin application and go to the “Asset Management” tab. 2. Choose the asset type for which you want to add a new asset. (e.g. pumping well or observation well) 3. Click on “Add Asset”. A dropdown menu will open. There are 2 options how to add a new asset: - a. “Add asset row”. This will add a row to the table. You can simply enter the name, the coordinate system (SRID) as EPSG number, X-, Y-coordinates. All other fields are optional. To finish, click the check mark on the right. - b. “Upload table”: With this option you can also add multiple assets. You can download a template file, which shows what the csv-file should look like for the upload. (Name = name of asset; SRID = coordinates system as EPSG number; X = x-coordinate; Y = y-coordinate) You have now added a new asset. |
   |
Edit existing asset
You can edit an existing asset.
| Instruction | Screen |
|---|---|
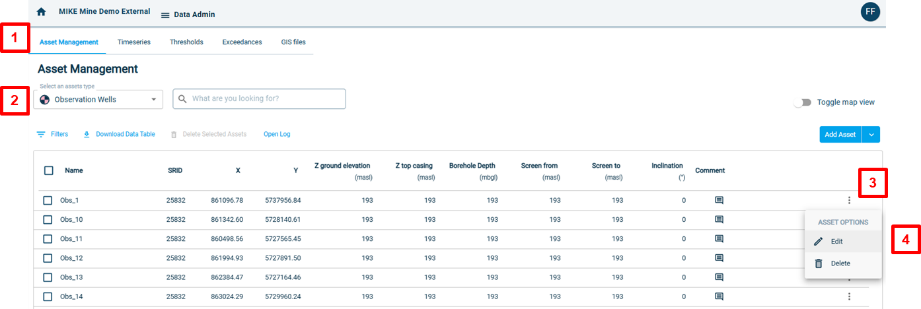
| 1. Open the Data Admin application and go to the “Asset Management” tab. 2. Choose the asset type for which you want to add a new asset. (e.g. pumping well or observation well) 3. Open the edit menu 4. Click on Edit. You are now in edit mode for this asset |
 |
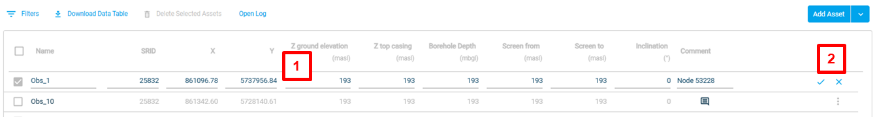
| 1. You can make changes by simply clicking into the fields. 2. To save the changes, click on the check mark. To discard the changes click on the “x”. |
 |
Add a timeseries
The following guide will explain how to upload a timeseries to MIKE Mine.
| Instruction | Screen |
|---|---|
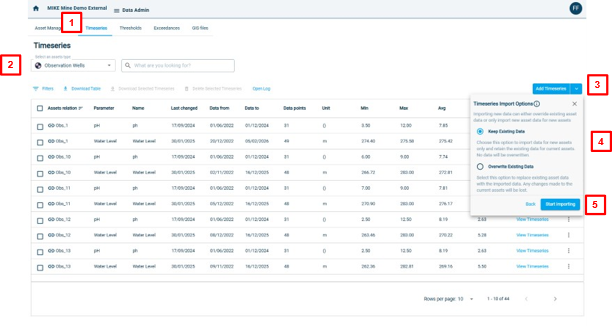
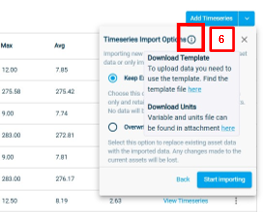
| 1. Open the Data Admin application and go to the “Timeseries” tab. 2. Choose the asset type for which you want to add a new asset. (e.g. pumping well or observation well) 3. Click on “Add Timeseries”. A dropdown menu will open. 4. You can choose to “Keep Existing Data” or to “Overwrite Existing Data” 5. Click on “Start importing” to start the import process. 6. To get some example templates, how the timeseries files should look like – hover over the “Info” button. You can then download an example template for a timeseries and also the parameters and units that MIKE Mine needs to recognise the timeseries data. |
  |
| After clicking on “Start importing” you will be asked to choose a csv-file. Click on “Open” once you have selected your csv-file. You will now be redirected to the timeseries import page. |
 |
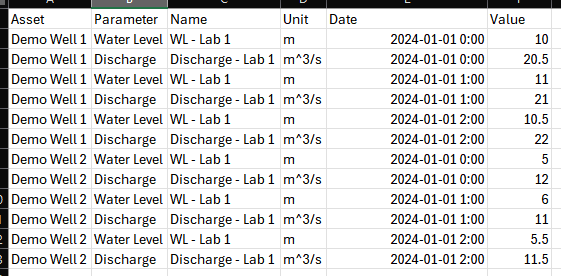
| Tips for csv-timeseries data format. You can download a template csv-file by following step 6 above. See screenshot on the right as example. The csv-file must contain the following information/rows: - Name of the asset. You should use the same name as the asset you added in the asset manager. Otherwise the timeseries will not be associated with the asset. - Parameter. There are given parameter names. You can find the list of parameters and units in the downloadable list in step 6 above. If you don’t use the correct unit, there will be an error. - Name of the timeseries. You can give the timeseries any given name. - Unit. Same behaviour as with parameter. There are given units. You can find the list of parameters and units in the downloadable list in step 6 above. If you don’t use the correct unit, there will be an error. - Date. The date format can vary. There are options later on to choose the correct date-time format during the import. - Value. This is the actual measured value for the timeseries. For example, the water level. |
 |
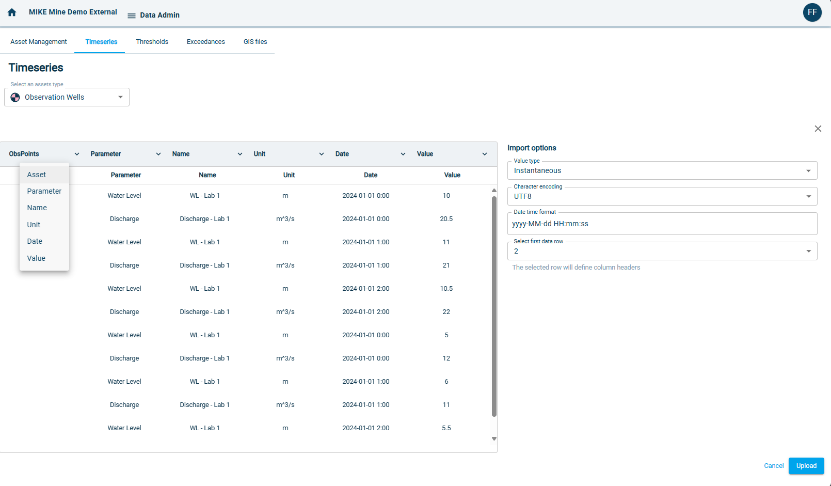
| Note: The names of the columns can differ from the column names in the csv-template. | 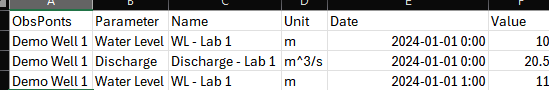 |
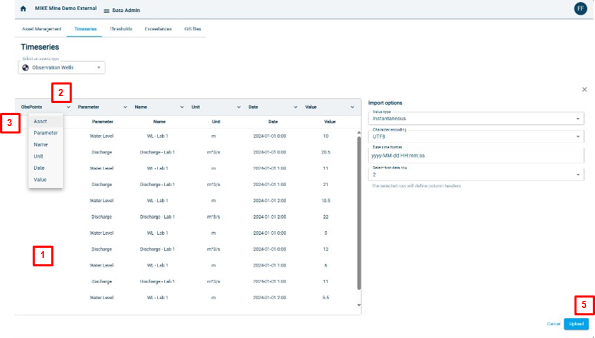
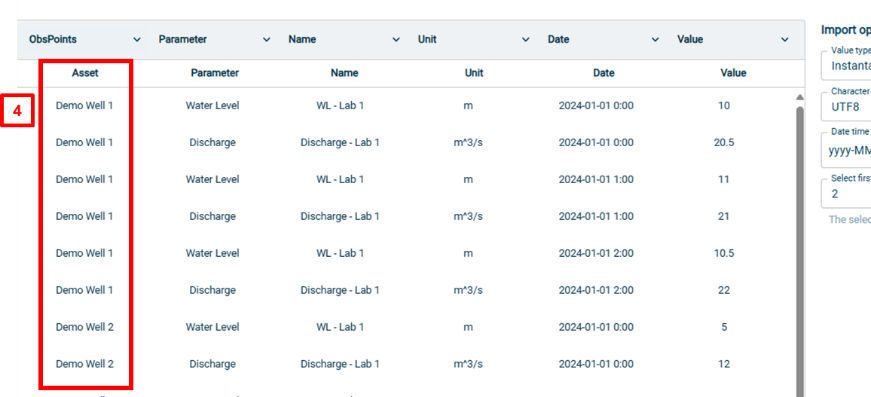
| In the example on the right, the column name for the asset name is called “ObsPoints”. 1. The data will still be shown in the import window. But the column for the values is empty. 2. Once you have imported the csv-file, you need to point the “ObsPoints” column to the “Asset”. Click on the “ObsPoints” dropdown menu. 3. Select “Asset”. Now there is a correct assignment. 4. You will now see data in the assigned column. 5. To finish the import click on “Upload” or click on “Cancel” to cancel the upload. |
  |
View a timeseries
You can view or edit a timeseries.
| Instruction | Screen |
|---|---|
| 1. Open the Data Admin application and go to the “Timeseries” tab. 2. Choose the asset type for which you want to add a new asset. (e.g. pumping well or observation well) 3. Click on “View Timeseries”. A new window will open up. |
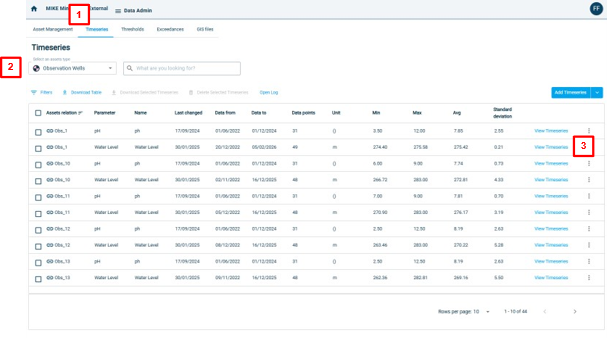 |
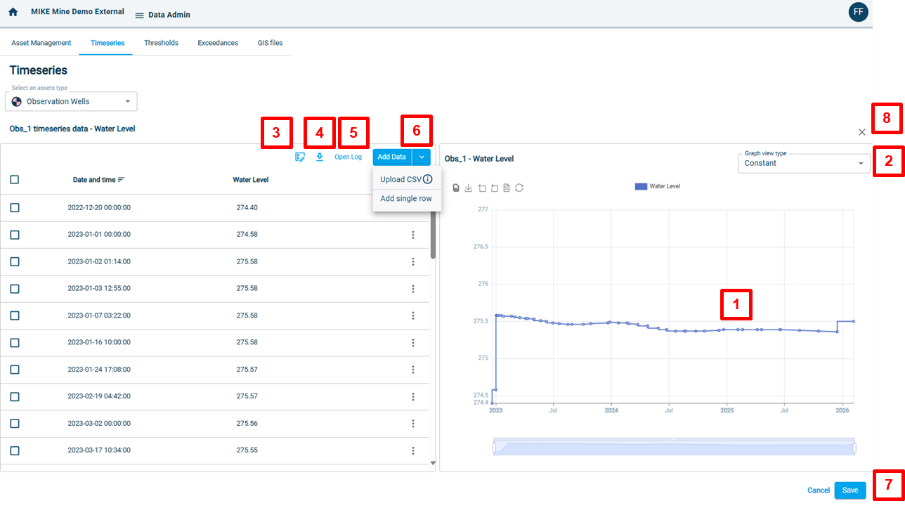
| You can now see the timeseries in data view and in graph view. There are different options to view or edit the timeseries. 1. You can click on a data point on the graph and the data point will be selected in the data view on the left. 2. The timeseries can be displayed as constant steps or as linear graph. 3. You can assign a value to multiple timesteps. 4. You can download the timeseries. 5. You can look a the log of the timeseries. The log contains information about the last changes and who did the last changes. 6. Add data to the timeseries. Either enter a single row or upload a csv file. 7. To save the changes click on “Save”. To discard the changes you made, click on Cancel. 8. You can simply close the timeseries-view window by clicking the “x”. |
 |
Edit thresholds
The “Data Admin” application provides a threshold manager to assign, edit or delete thresholds for timeseries.
| Instruction | Screen |
|---|---|
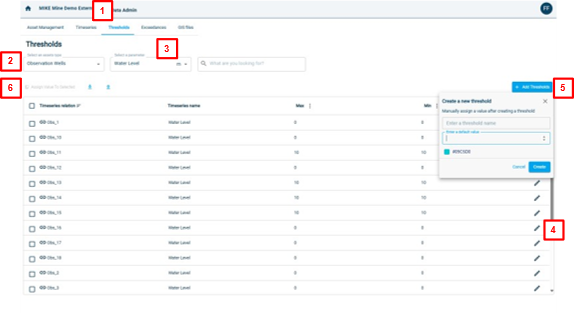
| 1. Open the Data Admin application and go to the “Threshold” tab. 2. Choose the asset type for which you want to add a new asset. (e.g. pumping well or observation well) 3. Choose the parameter you want to assign the threshold to. 4. To edit an existing threshold, click on the Edit button. You can now change the thresholds. To save the changes click on the check mark. To discard the changes click on the cross. 5. To add an additional threshold, click on “Add Thresholds”. Enter the name of the threshold (Note: The name has to be unique. It cannot have the same name as a already existing threshold.). The enter a default value and choose a colour. The colour is the line colour in graphs in the Reconciliation app. 6. To assign a value to multiple timeseries, use the “Assign Value to Selected” button. You first have to select one or more timeseries. |
 |
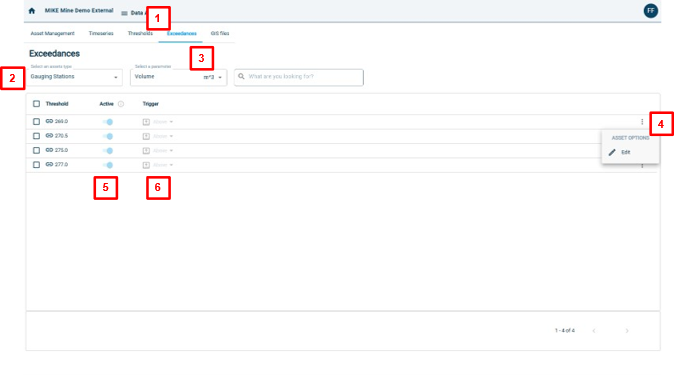
Edit exceedances
The exceedances are used to trigger warnings. That means that if a value in a timeseries either goes above a threshold or is below a threshold – then a warning is triggered. To set the exceedance rules or triggers follow the instructions below.
| Instruction | Screen |
|---|---|
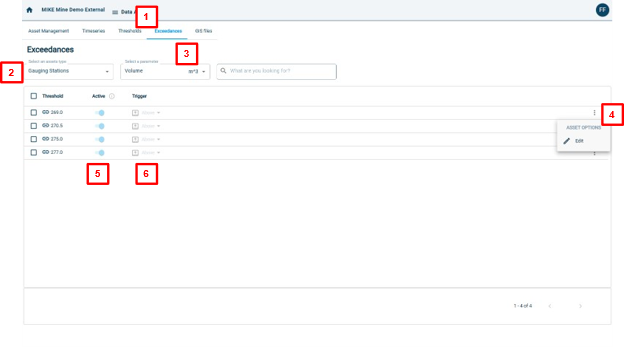
| 1. Open the Data Admin application and go to the “Exceedances” tab. 2. Choose the asset type for which you want to add a new asset. (e.g. pumping well or observation well) 3. Choose the parameter you want to assign the exceedance to. 4. To edit an exceedance, click on the Edit button. You can now change the exceedance rules. To save the changes click on the check mark. To discard the changes, click on the cross. 5. To activate or deactivate, use this button. Deactivation means, that warnings for this threshold will not be shown in the Reconciliation app. 6. To change when the warning is triggered, please choose “Above” or “Below”. “Above” means, that the warning is triggered, if a value in the timeseries is above this threshold. “Below” means, that the warning is triggered, if a value in the timeseries is below this threshold. |
 |
Add shape-file
In the GIS-files tab in the Data Admin application, you can upload or edit shape-files. These will be displayed in the Reconciliation application under “Thematic Maps”.
| Instruction | Screen |
|---|---|
| 1. Open the Data Admin application and go to the “GIS files” tab. 2. To add a shape-file, click on “Add Shape File”. A window will open. 3. Drag and drop a zipped shape-file into the box or click on “Upload Files” to choose a zipped shape-file manually. 4. Enter a name for the layer. This will be the name displayed in the Reconciliation app under Thematic Maps. 5. Click “Add” to import the file. Or click Cancel, to cancel the process. 6. To edit the imported shape-file, click on the edit button. You can now change the layer name, activate or deactivate the shape file or change the display colour of the shape file. |
 |