“Reconciliation”
The Reconciliation application is a map and timeseries applications, to show assets in map view and timeseries in graph view.
Show timeseries of multiple assets
Follow the steps below to show timeseries of multiple assets.
| Instruction | Screen |
|---|---|
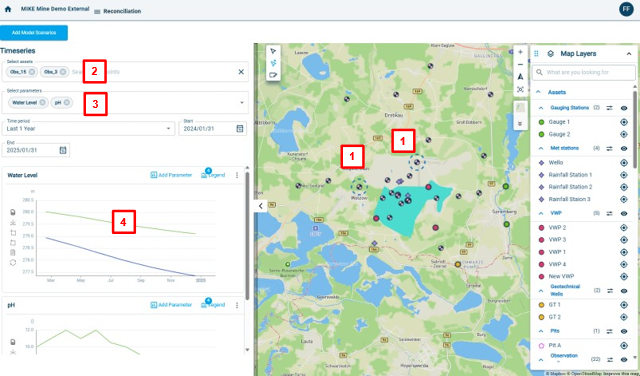
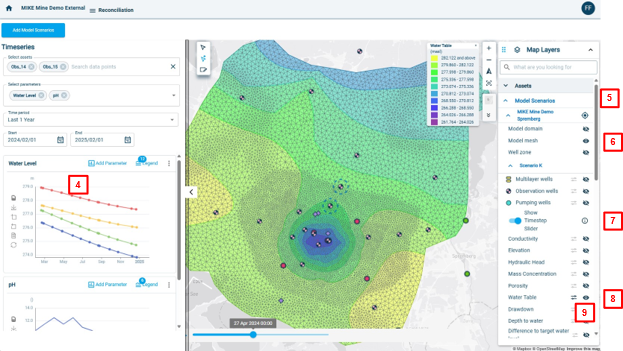
| Open the Reconciliation application. 1. Click on one or multiple assets in the map window. Once you have clicked on an asset, the associated timeseries will be shown in the left graph window. 2. The selected assets are displayed in the “Select assets” field. You can deselect an asset by clicking on the “x”. You can also add an asset by clicking in the empty field. A dropdown menu will appear with all assets. 3. The associated parameters for the selected assets are shown in the “Select parameters” field. You can select or deselect parameters to be shown as timeseries, by clicking on the dropdown menu button. 4. The timeseries of the selected assets and parameters will be shown as graphs. Each parameter is shown in a separate graph (e.g. one graph for water level and second graph for pH). |
 |
Add threshold and additional parameter to a graph
To add the threshold for a parameter to a graph and to add an additional parameter to the graph, follow the following steps.
| Instruction | Screen |
|---|---|
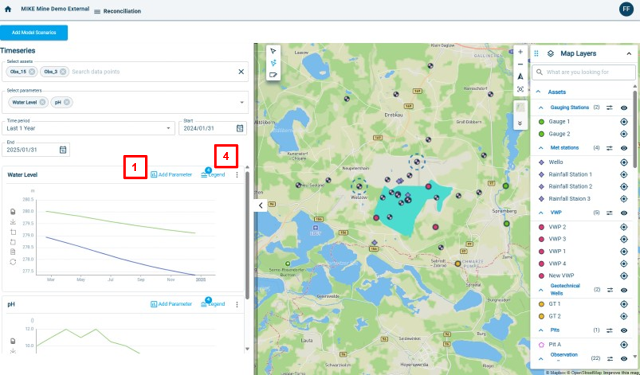
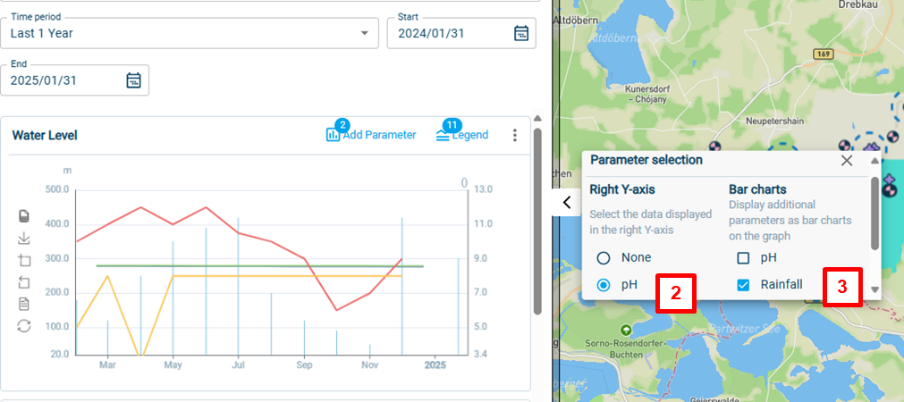
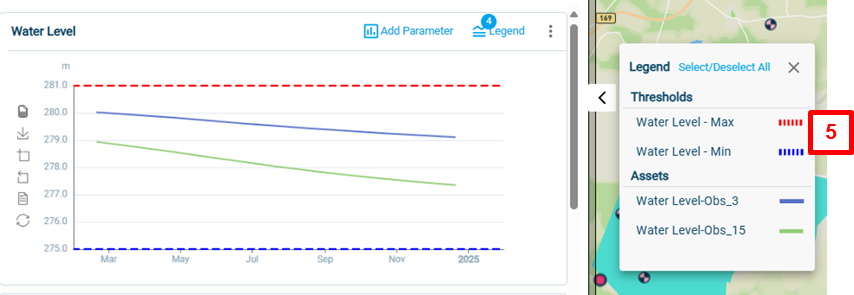
| Open the Reconciliation application. To add an additional parameter to the graph: 1. Click on “Add Parameter”. A window will open on the right. 2. To add a parameter that will be shown with a separate y-Axis, select a parameter under “”Right Y-axis”. 3. To add a parameter as bar chart, select a parameter under “Bar charts”. To add a threshold to the graph: 4. Click on “Legend”. 5. Select the threshold you want to show on the graph. The threshold will then be displayed as dashed line in the graph. |
   |
Load model results into the Reconciliation application
To add model results to the Reconciliation application follow the below steps. Adding model data is only applicable if you have loaded models into MIKE Mine.
| Instruction | Screen |
|---|---|
| Open the Reconciliation application. To add model results: 1. Click on “Add Model Scenarios”. A window will open. 2. Select the model results you want to load. 3. Click on Apply Visualisation options for the model results are explained below. 4. The results of the model will shown in graph view. You can therefore compare your model results with the measured data. 5. To view model results in map view, go to the “Model Scenario” part in the Map Layers panel. 6. To show the model domain or model mesh, click on the eye to make visible or disable. 7. If you want to skip through the different timesteps of the model results, enable “Show Timestep Slider”. The timestep slider will then appear at the bottom of the map window. 8. To show model results in map view, enable or disable by clicking on the eye. 9. You can change transparency of the model results by clicking on the options button. You can also show isolines in this options panel. |
  |
Show warnings in map view
If a threshold is exceeded, then a warning is triggered. To see the warning in map view, follow the steps below.
| Instruction | Screen |
|---|---|
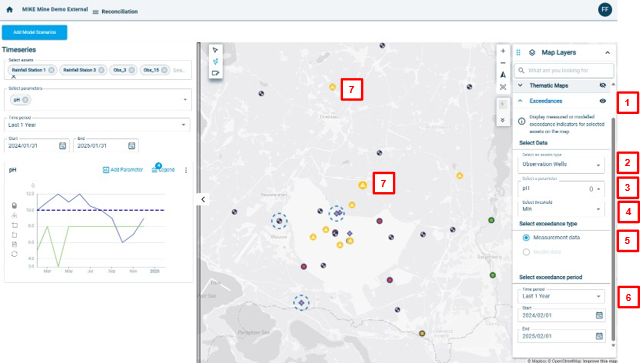
| Open the Reconciliation application. 1. In the Map Layers panel, go down to “Exceedances”. Then click on the eye to make the warnings visible. 2. Select the asset type. 3. Select the parameter. 4. Select the threshold you want to show the warning for. 5. You can select if you want to show the warning for your measured data or for modelled that that you have loaded into the Reconciliation app. 6. Select the time period for which you want to show the warning for. It means that you can check if warnings were triggered for different time periods. 7. You now see the warning signs for the assets that have triggered a warning. |
 |
Show GIS data
To show GIS data like shape-files in map view, follow these steps.
| Instruction | Screen |
|---|---|
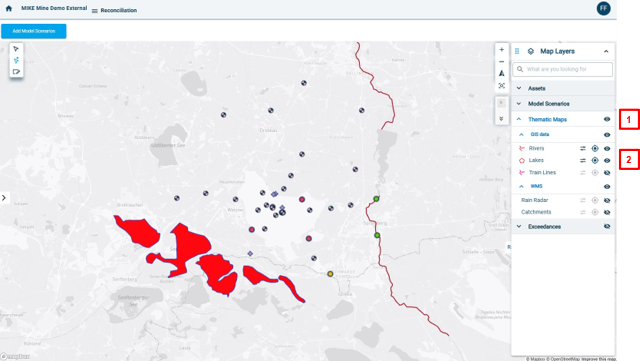
| Open the Reconciliation application. 1. Go to the “Thematic Maps” in the Map Layer panel. 2. You can see all available GIS-data in the panel. To visualise data, click on the eye. You can change the appearance by clicking on the options button – to change for example the transparancey. |
 |