“Result Viewer”: View and compare model results
You can compare model results using the Result Viewer applications. There are three different ways to compare results of different model scenarios:
- Comparison in map view,
- Comparison in cross section view and
- Comparison in timeseries view.
This guide shows how to compare results using all three comparison methods.
| Instruction | Screen |
|---|---|
| Open the Result Viewer, either by selecting it in the home view or by using the navigation panel. | 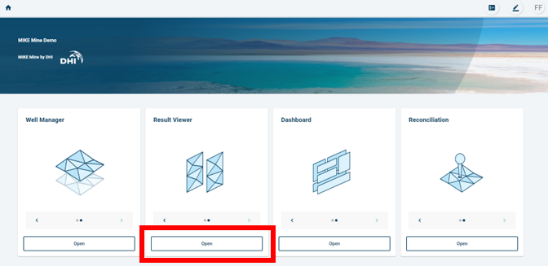 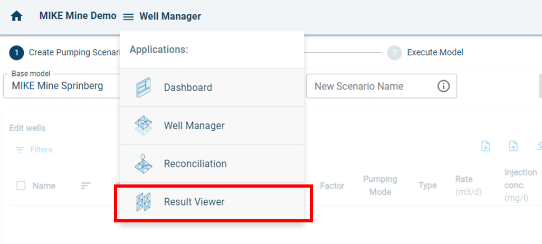 |
| By default, you will be in the “Plan View” view. As an example, you want to compare the drawdown of two model scenarios in Slice 10. Follow the below steps: 1. Select two scenarios that you want to compare using the drop-down menus. 2. Show the drawdown by making it visible using the “eye” button. 3. Choose Slice 10 either from the drop-down menu on the right or the slider button on the left. 4. Change the timestep by using the slider. |
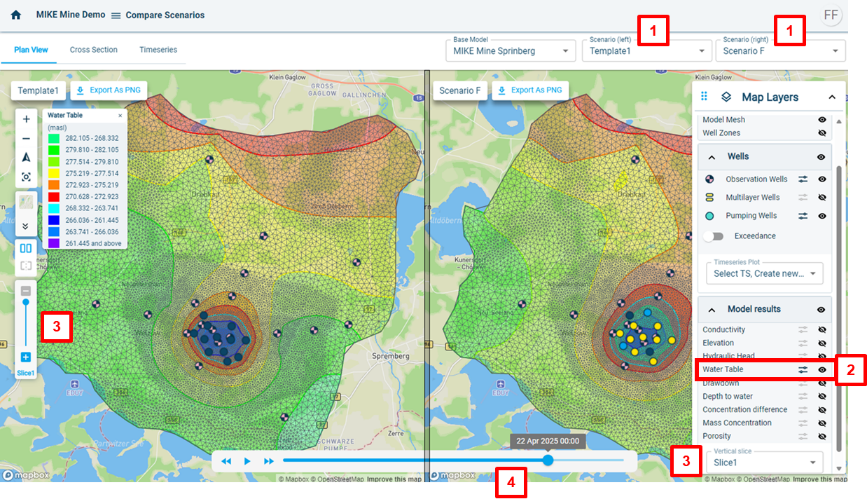 |
| There are additional options to show the results in map view. • Click on the settings button next for one of the model result parameters • In the pop-up window you can choose different visualisation options. |
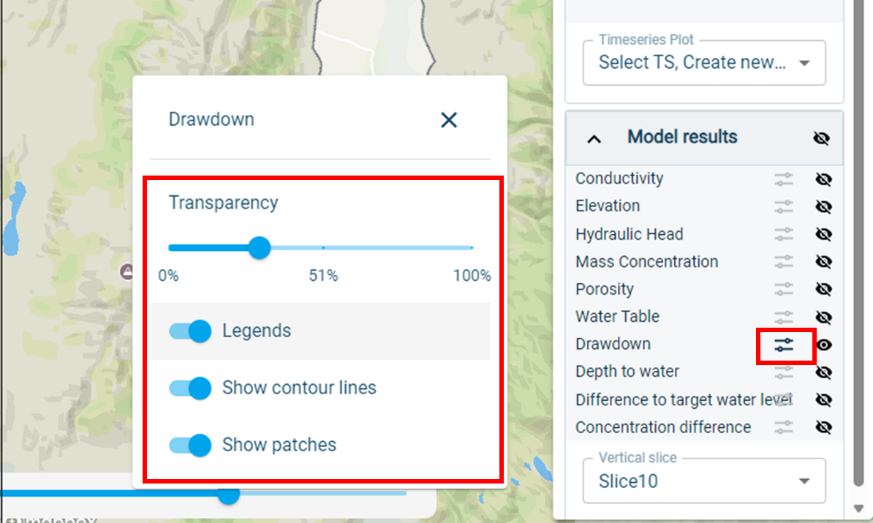 |
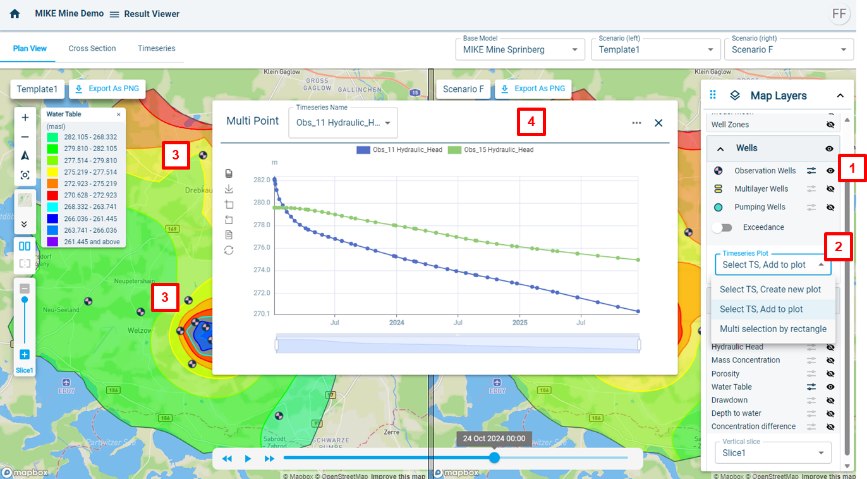
| To show timeseries data in the plan view, follow the below steps: 1. Make for example the observation wells visible, by clicking on the “eye” button. 2. You can change how you select assets on the map to show timeseries by clicking on the “Timeseries Plot” dropdown. To compare multiple timeseries choose “Select TS, Add to plot”. 3. Click on multiple observation points in the map view. 4. A window will appear, showing the timeseries data for the selected assets. The timeseries window has several functionalities, like showing and hiding timeseries, data table view, zoom functions and others. |
 |
| To compare model results in cross section view, click on “Cross Section”. |  |
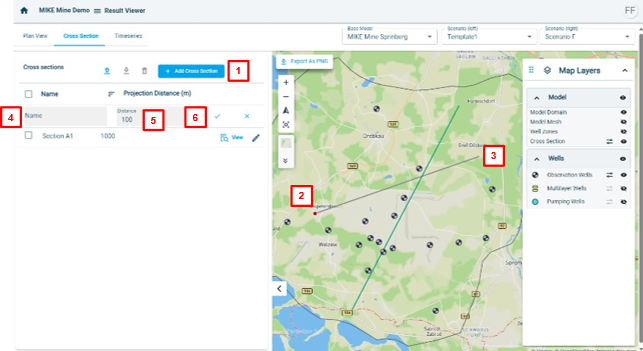
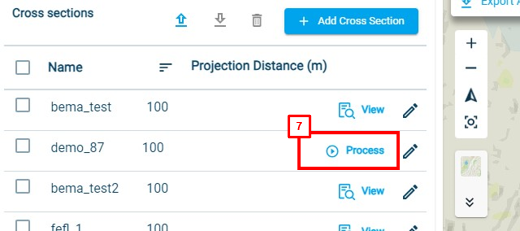
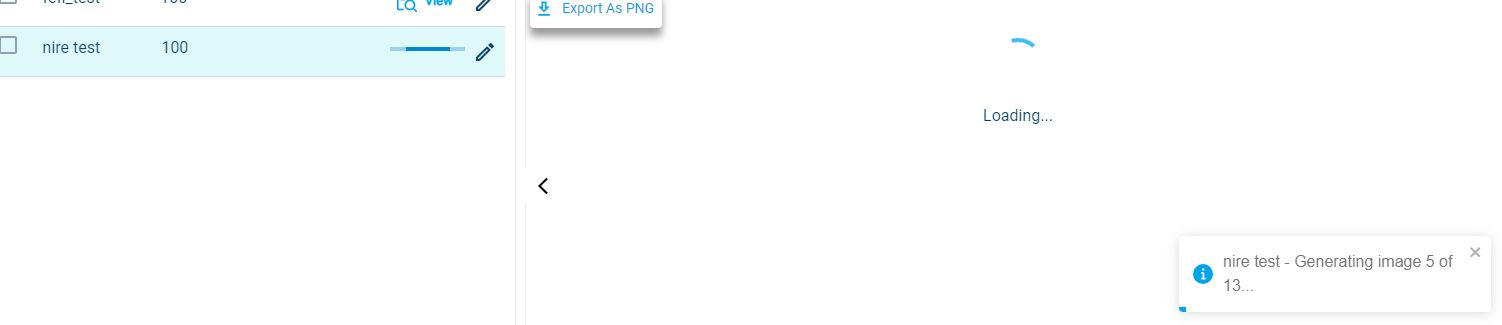
| To create a new cross section, choose two model scenarios that you want to compare and follow the below steps: 1. Click on “Add Cross Section”. You will now be in the creating cross section mode. 2. Go to the map, and click to add the starting point of your cross section. 3. Click a second time to end the cross section. 4. A new row will be added to the cross section table. Please enter a name for your cross section. 5. Choose the distance for projection. This means well locations that are within this distance will be projected onto the cross section. 6. Click on apply to save the changes or discard the cross section by clicking on X. 7. You can now process the cross section. This will create the cross section for the selected scenarios. The creation of the cross section might take a while, depending on the timesteps saved in the model result file. |
   |
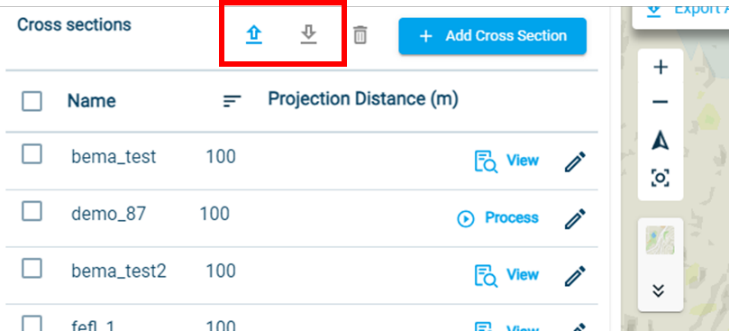
| You can upload and download cross section lines. To do so, follow the below steps: 1. To download a cross section, select one or multiple cross sections and click on “Download” 2. To upload a cross section line, simply click on “Upload”. |
 |
| To view the cross section in cross section view click on “View”. To show different model result parameters use the “Item name” drow-down menu. To export the cross section, click on “Export As PNG”. To go back to the map view click on “Go back to map view”. |
|
| To compare model results in timeseries view, click on “Timeseries”. | 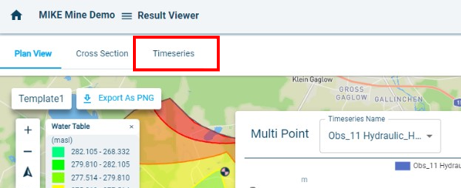 |
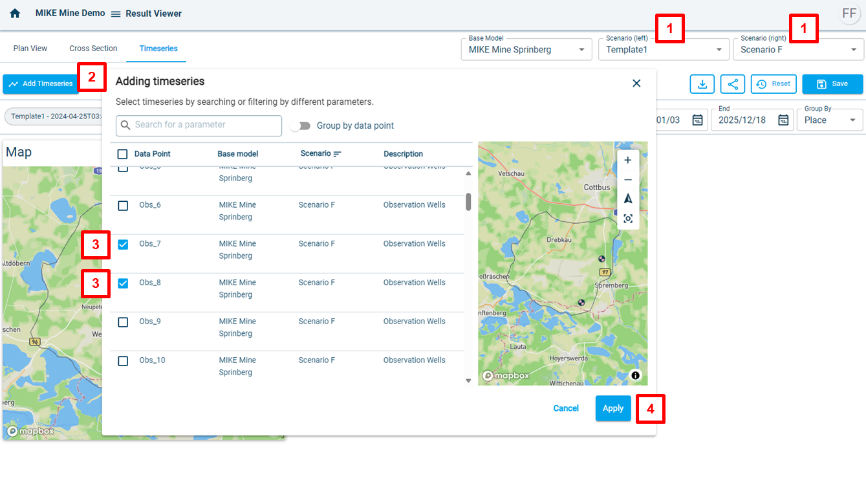
| To compare timeseries for different model scenarios follow the below steps: 1. Choose the model scenarios you want to compare. 2. Click on “Add Timeseries” 3. Select the assets that you want to show in timeseries view. 46. Click on Apply |
 |
| There are several visualisation options available, which are described below: 1. You can change the position of the windows by drag and drop. Resizing the windows is also possible, by clicking on the bottom right corner. 2. You can change the time period which is shown in the timeseries graphs. 3. Several plotting options for the graphs are available in the settings menu. For example it is possible to show the data as line or bar charts. 4. To save the changes you made, please click on “Save”. 5. To download the dashboard as png, click on the download button. 6. To share the dashboard via a link, click on the share option. Your colleagues can then open the link and view the dashboard. It is only a viewing option, no changes can be made to the dashboard by the invites. |
 |