Appendix A
Appendix A: Generating meshes controlled by a background density function
One major difficulty frequently encountered in unstructured meshing is the ability to control the variations in mesh density (i.e., the spatial variations in elemental sizes) over the entire domain.
A powerful approach is therefore proposed to achieve such a task. The method relies on the presence of a user-defined (mesh) density function in the form of a raster variable. This variable can be arbitrary, while expected to be positive definite. The content is directly taken as expected mesh density value in the 2D (x,y) Euclidean space. Optionally, the gradient of the submitted variable can be taken as density function.
1. Method description
The overall principle is quite simple and relies on a Centroidal Voronoi Tessellation (CVT) technique whose aim is to create a point cloud equal to centers of Voronoi cells, i.e. the dual graph of a Delaunay-conform triangulation.
The minimization of an energy functional will typically generate point clouds that satisfy Voronoi constraints, i.e., the created points are centres of Voronoi cells. Consequently, such a point cloud can eventually be converted into a 2D or 3D Delaunay-conform triangulation by minimally connecting the Voronoi cell centers.
Furthermore, the approach naturally allows a smooth and continuous control on the spatial variations of mesh densities when adding a rejection principle that consumes a background density function.
A CVT can be summarized as follows. Let  be the Euclidean norm in
  ,
,  be an open set, and
  be a set of _n points in
  . The Voronoi tessellation (or Voronoi diagram) of is the set
  defined as:
 |
(5.1) |
|---|---|
 |
(5.2) |
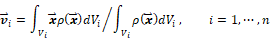
The set is referred to as generating points or generators, while each  corresponds to a Voronoi region (or cell) corresponding to
  . Given a density function
  defined for all
  , then for each Voronoi region the mass centroid or centre of mass
  of is defined by:
 |
(5.3) |
|---|---|
A tessellation as defined by this set of equations is called a CVT if and only if 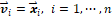 . This is equivalent to saying that all points
  act as generators associated with the Voronoi regions and are the mass centroids of these regions.
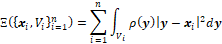
Now let define the following energy functional:
 |
(5.4) |
|---|---|
A necessary condition for  to be minimized is that
  is a CVT of . The control on the desired mesh spatial density
  is achieved by applying a rejection principle during a random generation of the point clouds.
2. Pseudo-algorithm
The following pseudo-algorithm is for the 2D (x,y) Euclidean space. The 3rd dimension follows the same principles and is adding no further complexity. The input polygon  and density function
  can be mapped into the unit square domain for convenience,
 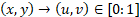 . The generation domain becomes
  masked by .
-
Define how many points to generate as mesh nodes: n Define a number of sampling points:

-
Generate the n points
 randomly
 -
Generate the m sampling points
 using a Monte-Carlo method with density function as driver of the rejection principle:
 -
Generate a uniform random number

-
Generate a uniform random number
 {
Generate a uniform random number
{
Generate a uniform random number 
 accept p
else reject p and retry
Add p to sampling list
Stop if m is reached
}
else
reject p and retry
accept p
else reject p and retry
Add p to sampling list
Stop if m is reached
}
else
reject p and retry
- Define the Voronoi region
 of gathering together
  in the closest points among the Voronoi points:
 {
Compute the average
{
Compute the average  of the set and update :
 }
}
-
Go to 2 or stop iterations if the new Voronoi points meet some convergence criterion and/or if the maximum allowed number of iterations is overflown
-
Connect the Voronoi cell centers to finalize the mesh using a constrained Delaunay mesher, with or without refinement relationships.
Remarks:
- The update of the Voronoi cells position starts with initial condition
 ;
; - The set of coefficients
 must satisfy the constraints
  ;
; - Therefore both
 and
and  may be negative, so the ensemble defines under- and over-relaxation updating methods;
 - The case
 yields
  , i.e. the average of the points in . Since the points in are randomly generated in the Voronoi region corresponding to
  ,
,  can be regarded as a probabilistic approximation to the centroid of , so that this configuration is like a probabilistic version of a Lloyd's method.
Examples
In this example, the English Channel is meshed. The polygonal data corresponds to a closed multi-polygon object with holes (defining islands) espousing the coastlines of France and of the UK. Bathymetry data is used to formulate a mesh density function in which the correlation engaged looks at the bathymetry variations, in form of the absolute value of bathymetry gradient, . Consequently, the higher the bathymetry local variation the denser the mesh is expected.
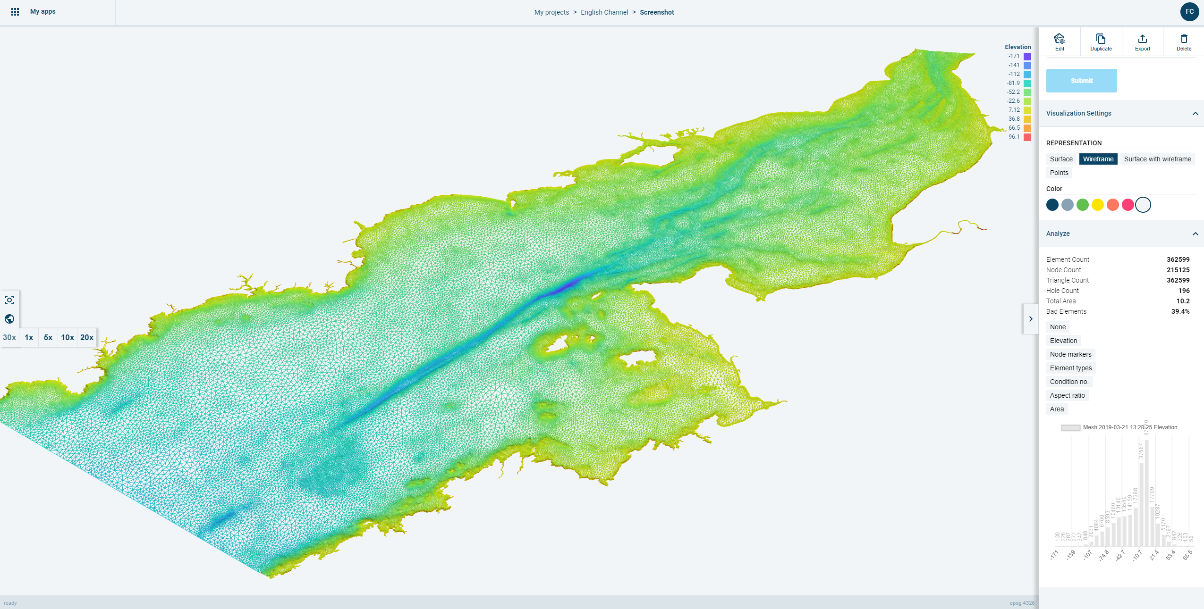
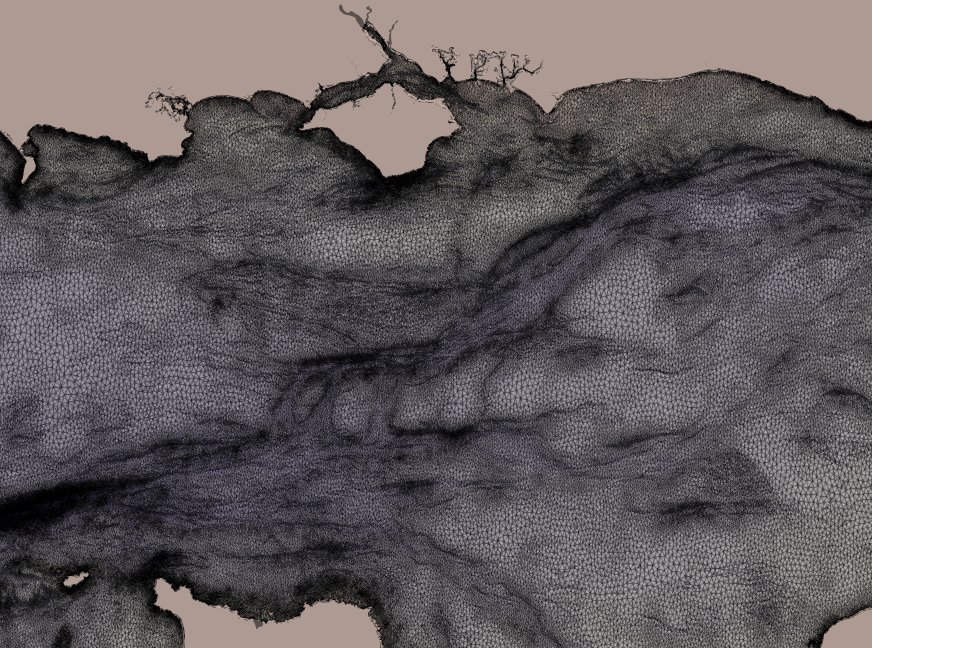
Figure 5‑1 Density function aided meshing results. Top: Mesh density correlated by bathymetry gradient (the coloured variable is nodal elevation); Bottom: Close-up on the mesh revealing the smooth densifications and relaxations of mesh density in relation to bathymetry gradients.