View and interact with the results in MOOD
After the MIKE Metocean Simulator outputs have been published to MOOD the user can interact with the data in MOOD.
Go to the MOOD site: https://www.metocean-on-demand.com/

If you have logged off since running and publishing MIKE MS, sign in using the same user name and Tenant as you used for setting up the MIKE MS model.
In the layers panel on the left, you need to activate the local model area and the local model points, as shown in the figure below.
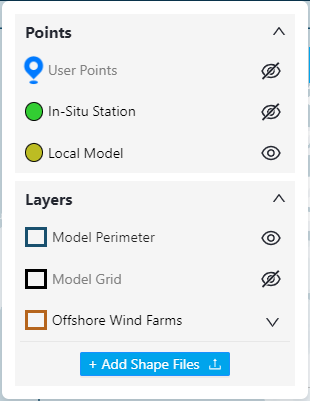
Layers panel in MOOD showing the toggle switches for displaying the local model
You should see your model domain and points in the map, as shown in the figure below.

Local model domain and points as indicated on the map in MOOD
Double click one of the points to see basic metadata of the MIKE MS point, as shown below.
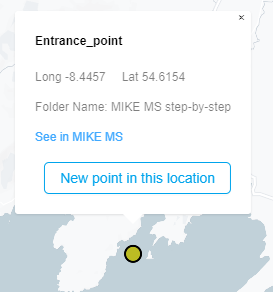
Information of the point displayed on double click.
Click “New point in this location” to define a new MOOD point at the location of the MIKE MS point.
In the points panel on the right, as shown below, you can select a subset of the data. In this case the full timeseries (44 years) is selected.
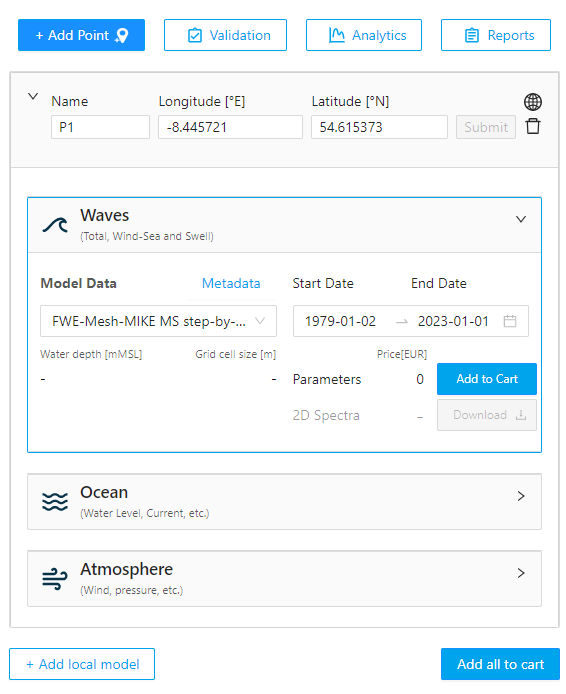
Points panel in MOOD. Here a subset of the data can be selected if required.
The data can be downloaded from MOOD by adding it to the cart and checking it out for free.
Click on the analytics button to make plots of the data:

The analytics modal will pop up, from which several analytics can be generated. The timeseries, rose and scatter plots can be created without a MOOD subscription. Examples of these are shown below in the three figures below, respectively.

Timeseries plot in MOOD
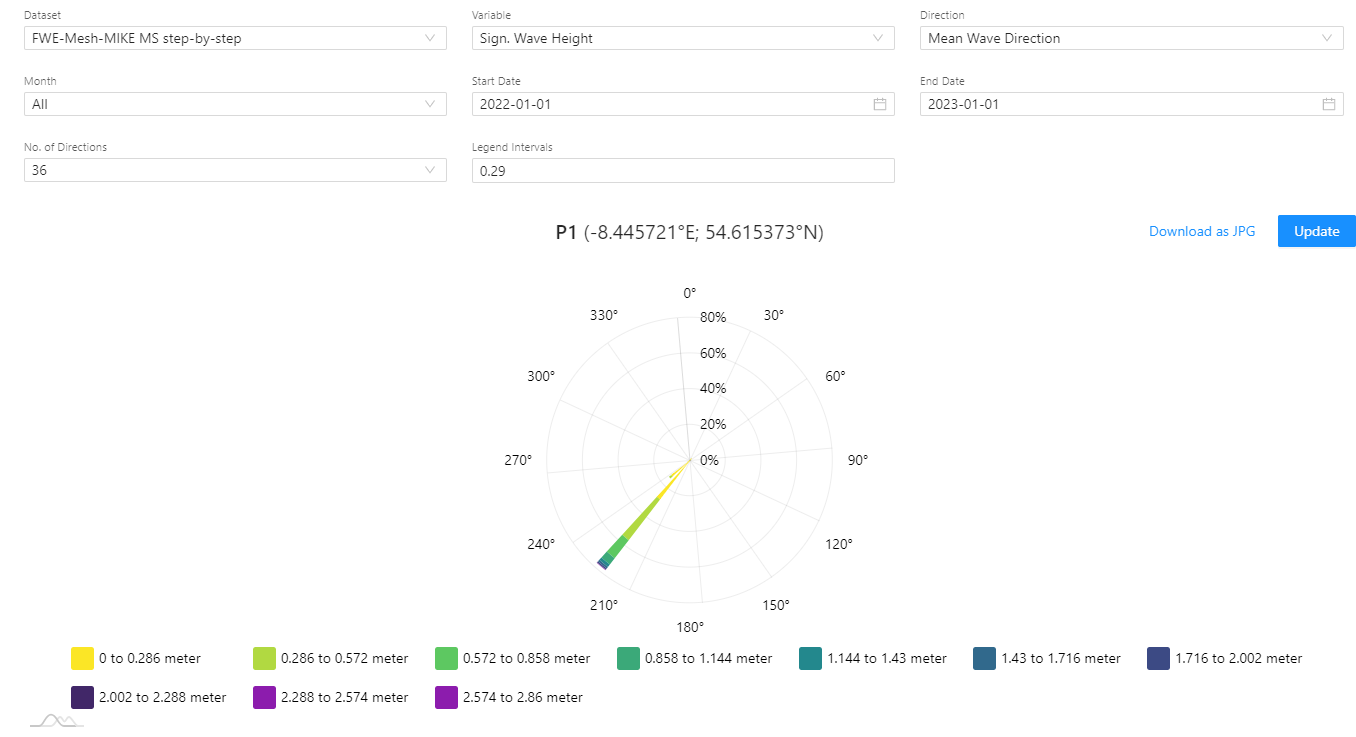
Rose plot in MOOD
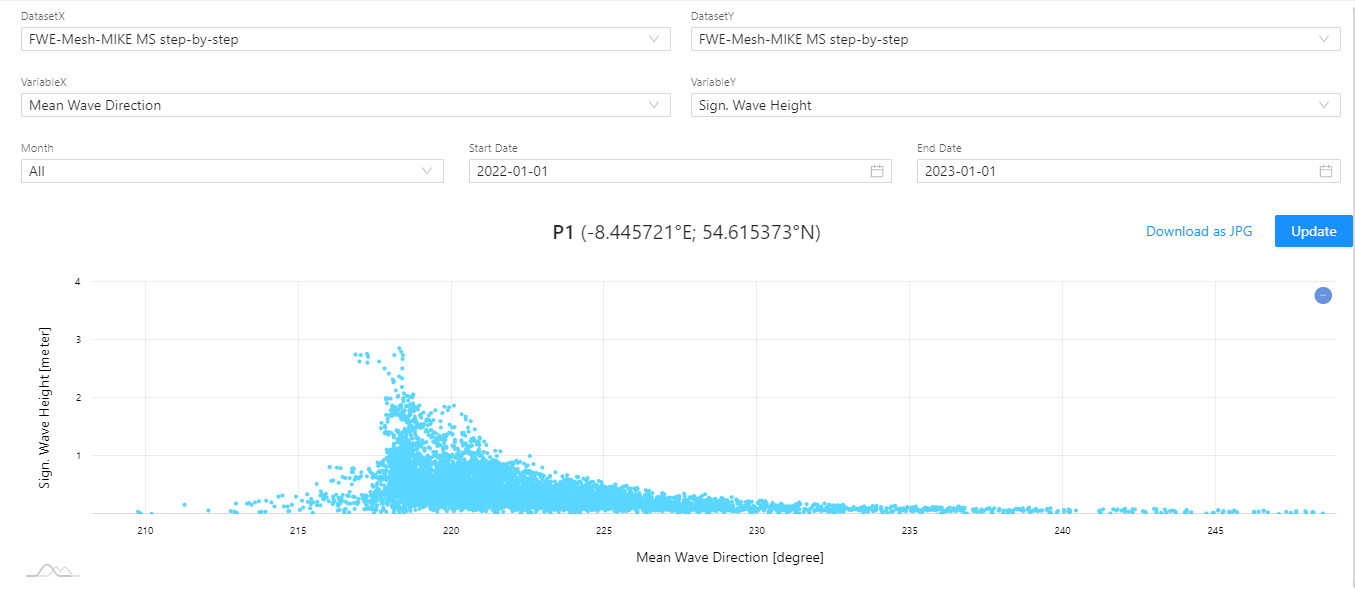
Scatter plot in MOOD
Users subscribed to MOOD analytics can make additional analytics for the full datasets, including Scatter tables, Statistics plots, Exceedance plots, Histograms, Weather windows and Extreme values. Users who are not subscribed to MOOD analytics can only use the last year of data using the additional analytics.