Defining and executing a Sediment Scenario
For defining a scenario, Select the project from the list of projects in Project Management Page. Click on ‘Add Ecological Scenario’ button

Scenario definition
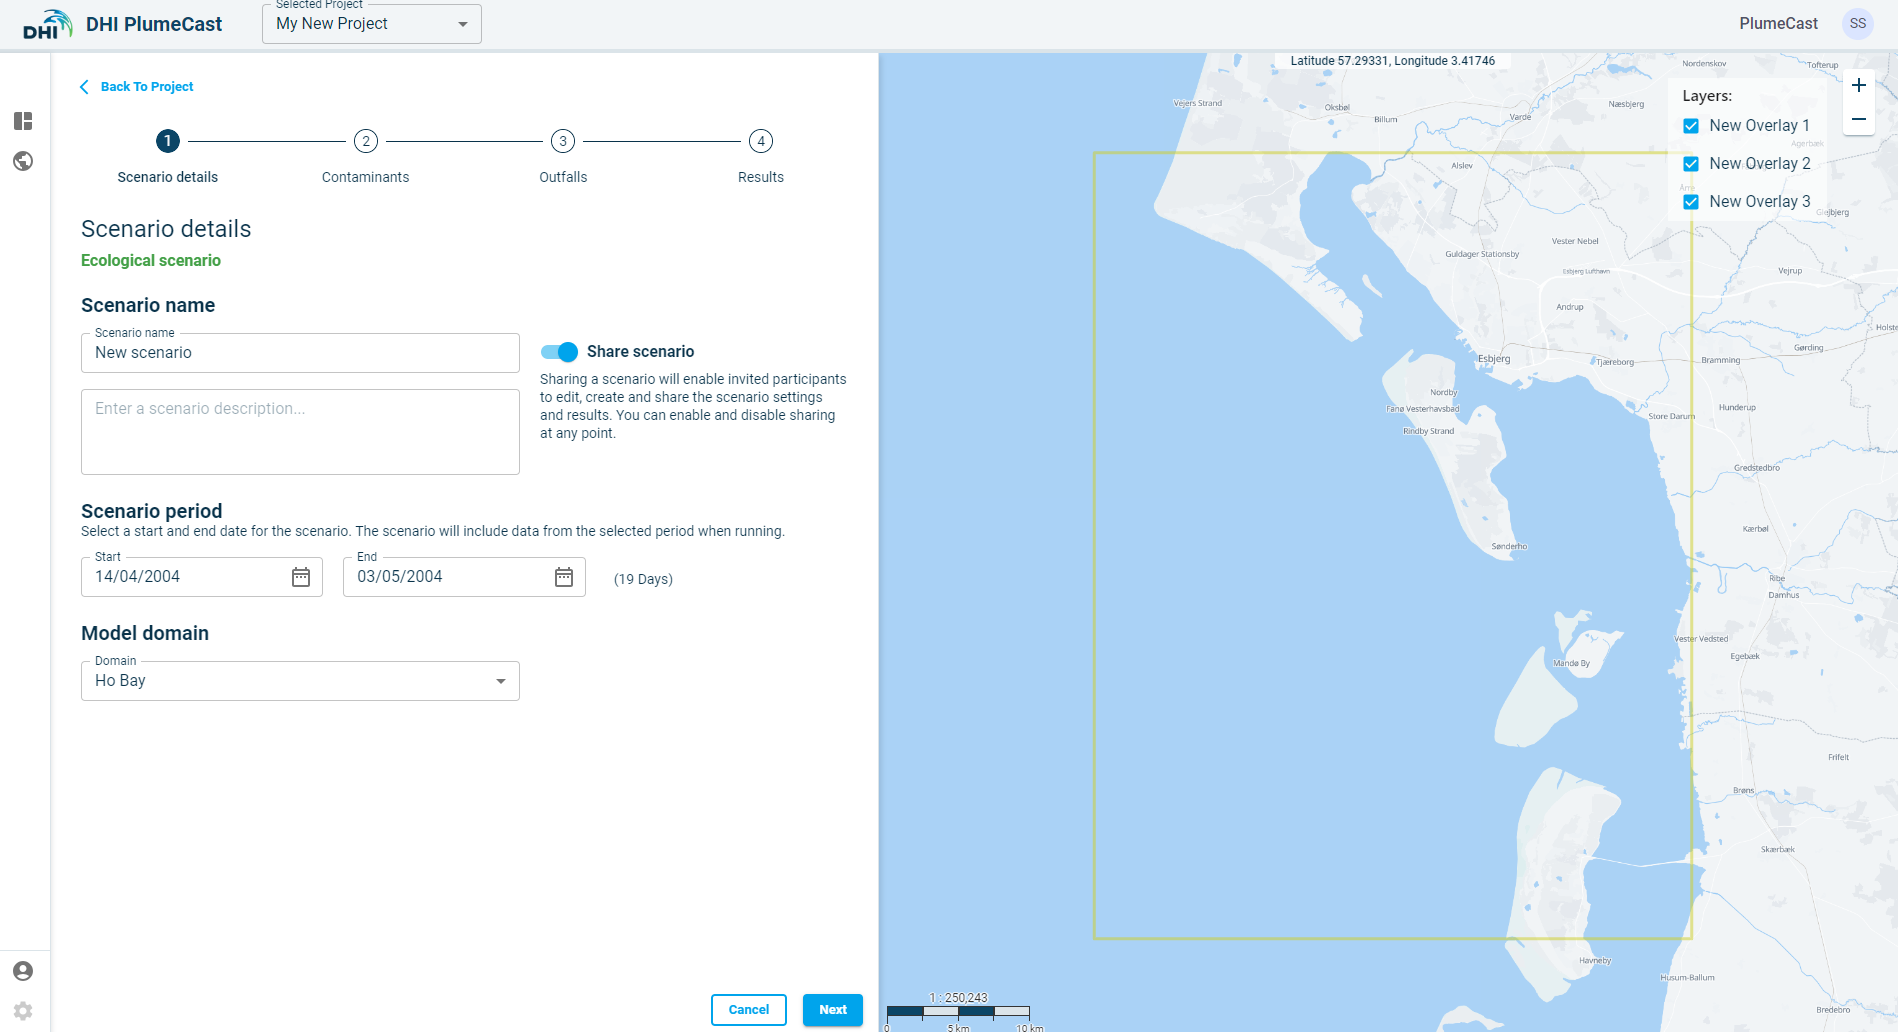
In the first step, you must give a name to the scenario. The name must be unique among other scenarios in this project.
You can choose the scenario to be ‘Private’ or ‘Shared’. ‘Private’ scenario is only visible to your user account. ‘Shared’ scenario will be visible to all other user accounts within your company.
Other DHI PlumeCast users within your company can see the scenario in their list of scenarios, but they only can see the Results. They do not have access to edit or delete the scenario.
You must select the domain from the list of available domains from the ‘Scenario Domain. The available domains correspond to the available MIKE models which have been set up and prepared for you by DHI PlumeCast administrators.
As soon as you choose the domain, the map zooms to the location of the domain. The bounding box containing the domain (in which the model is defined) are shown by a yellow rectangle on the map.
You must choose the start and end dates for the scenario. By default, they are set to the earliest and latest available dates in the chosen domain. You can choose start and end dates within this range, but not outside of it.
You can set an initial condition for your scenario. In the drop-down list, you can see a list of previously completed scenarios which have the same domain. By choosing an initial condition, the suspended sediment concentration fields and seabed deposition fields from the last time step in the chosen scenario will be used as initial conditions for the scenario you are defining now.
Finally you can add a description text for this scenario, to help noting necessary information which one should know when executing/editing this scenario.
Definition of contaminants
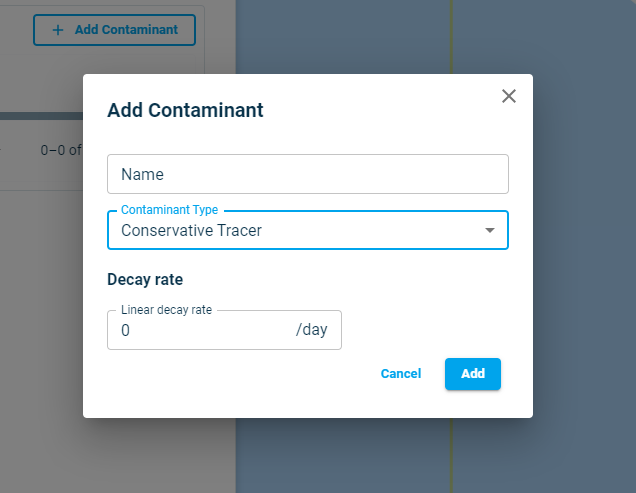
In this section you must define the type of contaminants. Depending on the selected domain’s model settings, you can select between three different types of contaminants to be modelled by clicking on “Add New Contaminant”. A scenario can accept only one type of contaminant at a time.
- Conservative tracer: This type of contaminant can be selected for simulating the dispersion of tracers or any similar type of mater, with or without a simple linear decay rate (shall be provided in rate “per day”). You can more than one of this type of contaminant to your scenario.
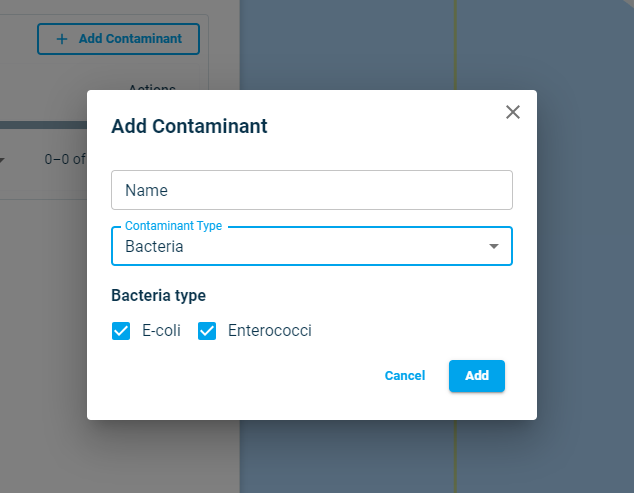
- Bacteria: Currently, you can choose from two types of Bacteria- Enterococci or EColi to be modelled in your scenario. The characteristics of these two types are already set and fixed within the model setup. Once a Bacteria is added to the scenario, no other contaminant type can be added.
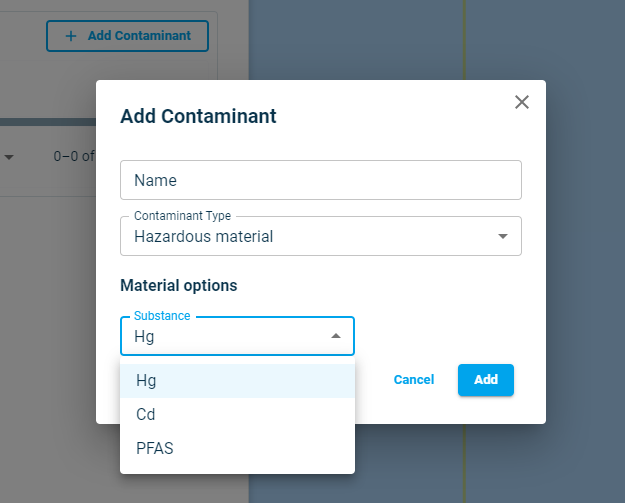
- Hazardous materials: This type of contaminants represents heavy metals and similar environmentally hazardous substances such as PFAS. Depending on the selected domain’s model setup, you can choose from different types of metals or other substances. Once a Hazardous material type is added to the scenario, no other contaminant type can be added.
Outfalls
In this section, you can define the outfalls from which the contaminants will be discharged into the ambient water.
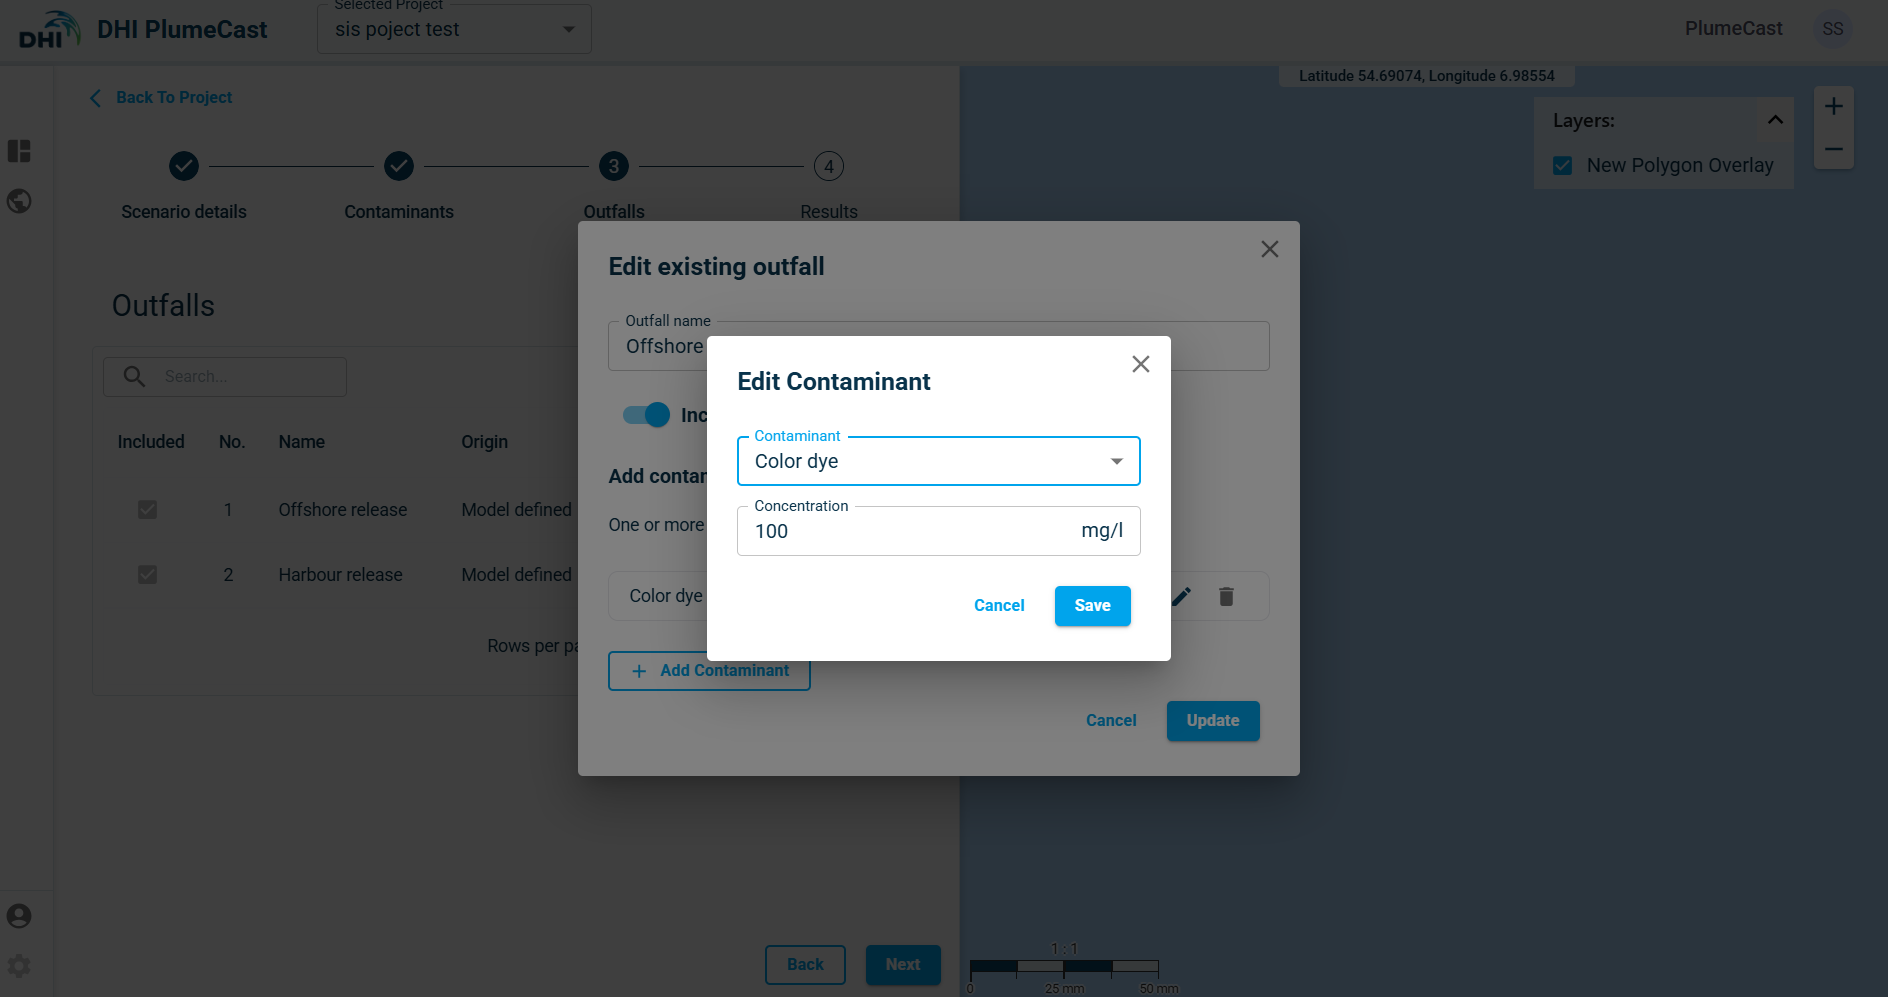
Defined contaminants in the previous step can be added to the outfalls with user defined concentration.
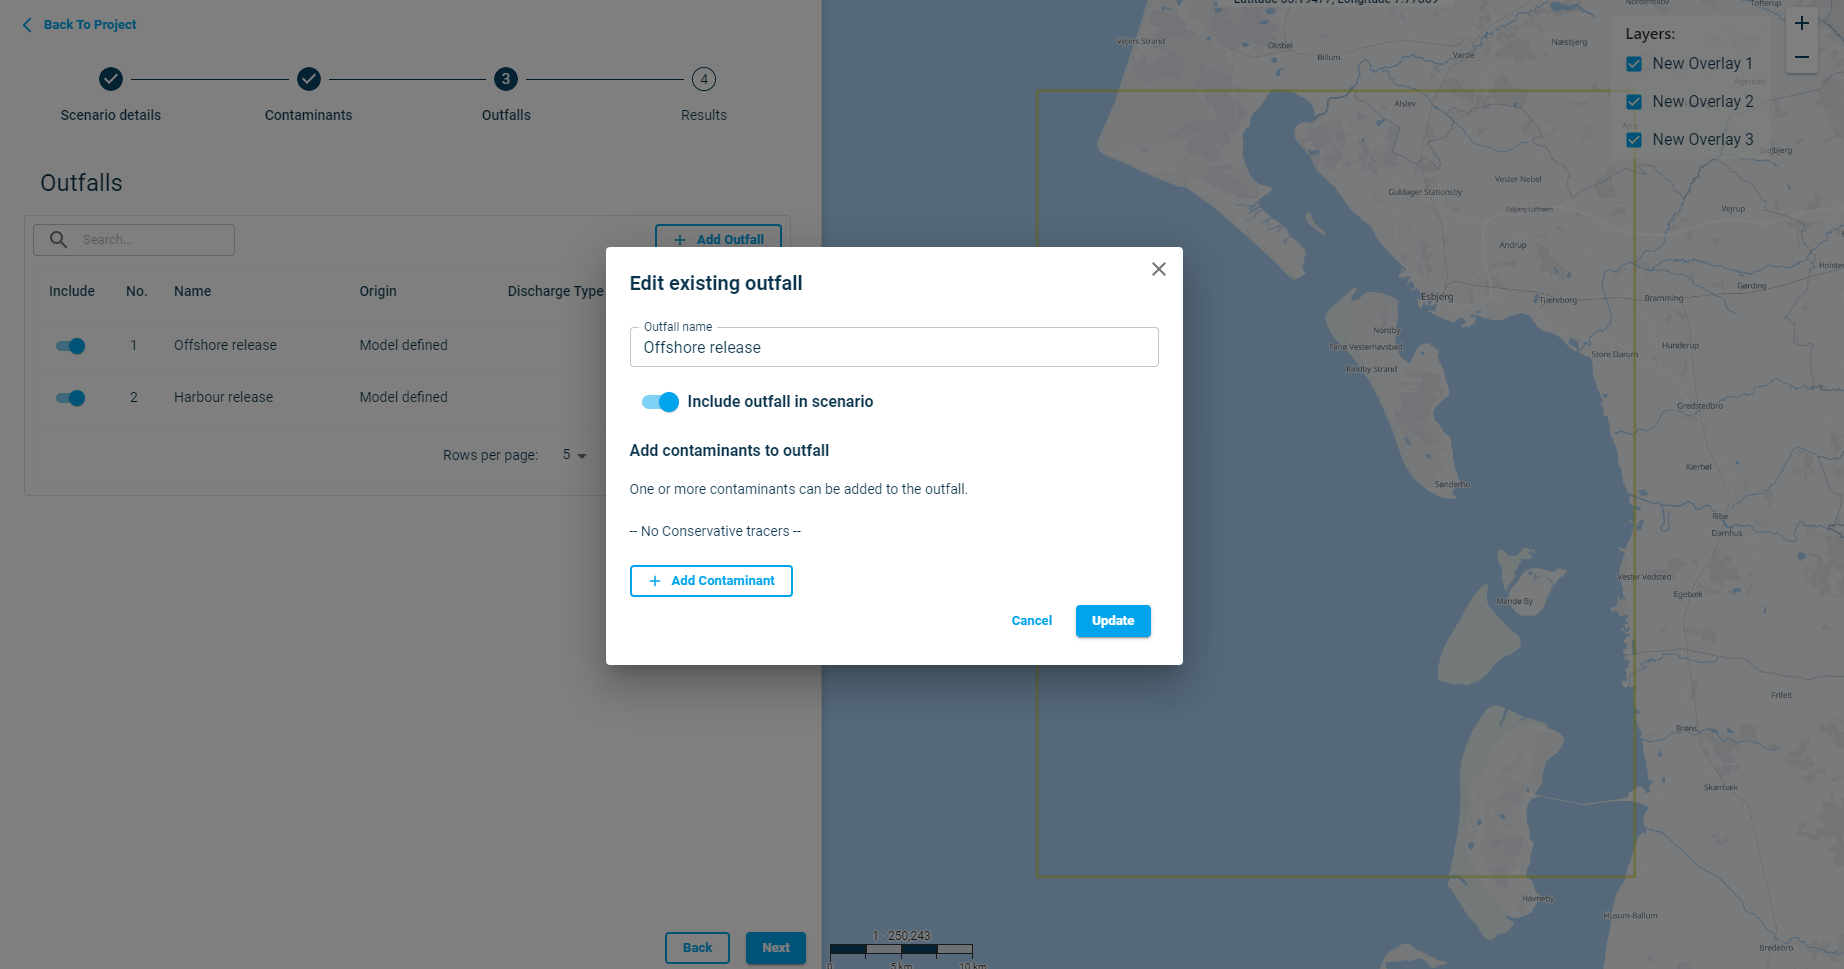
Depending on the selected domain model, there might be an existing outfalls in the model. It is not possible to modify the properties (location and discharge rate) of these existing outfalls. You can however exclude them from your scenario if needed or simply not add any contaminants to them.
To add contaminants to an existing outfall, click on the Edit sign ![]() of the corresponding outfall, select a contaminant and provide a concentration for it to be discharged.
of the corresponding outfall, select a contaminant and provide a concentration for it to be discharged.
In addition to the existing outfalls, you can add new outfalls and assign contaminants to them.
Note: Adding new outfall to the model requires execution of the hydrodynamic model, hence will slow down the simulation time.
Click on “Add Outfall” to add a new outfall to your scenario.
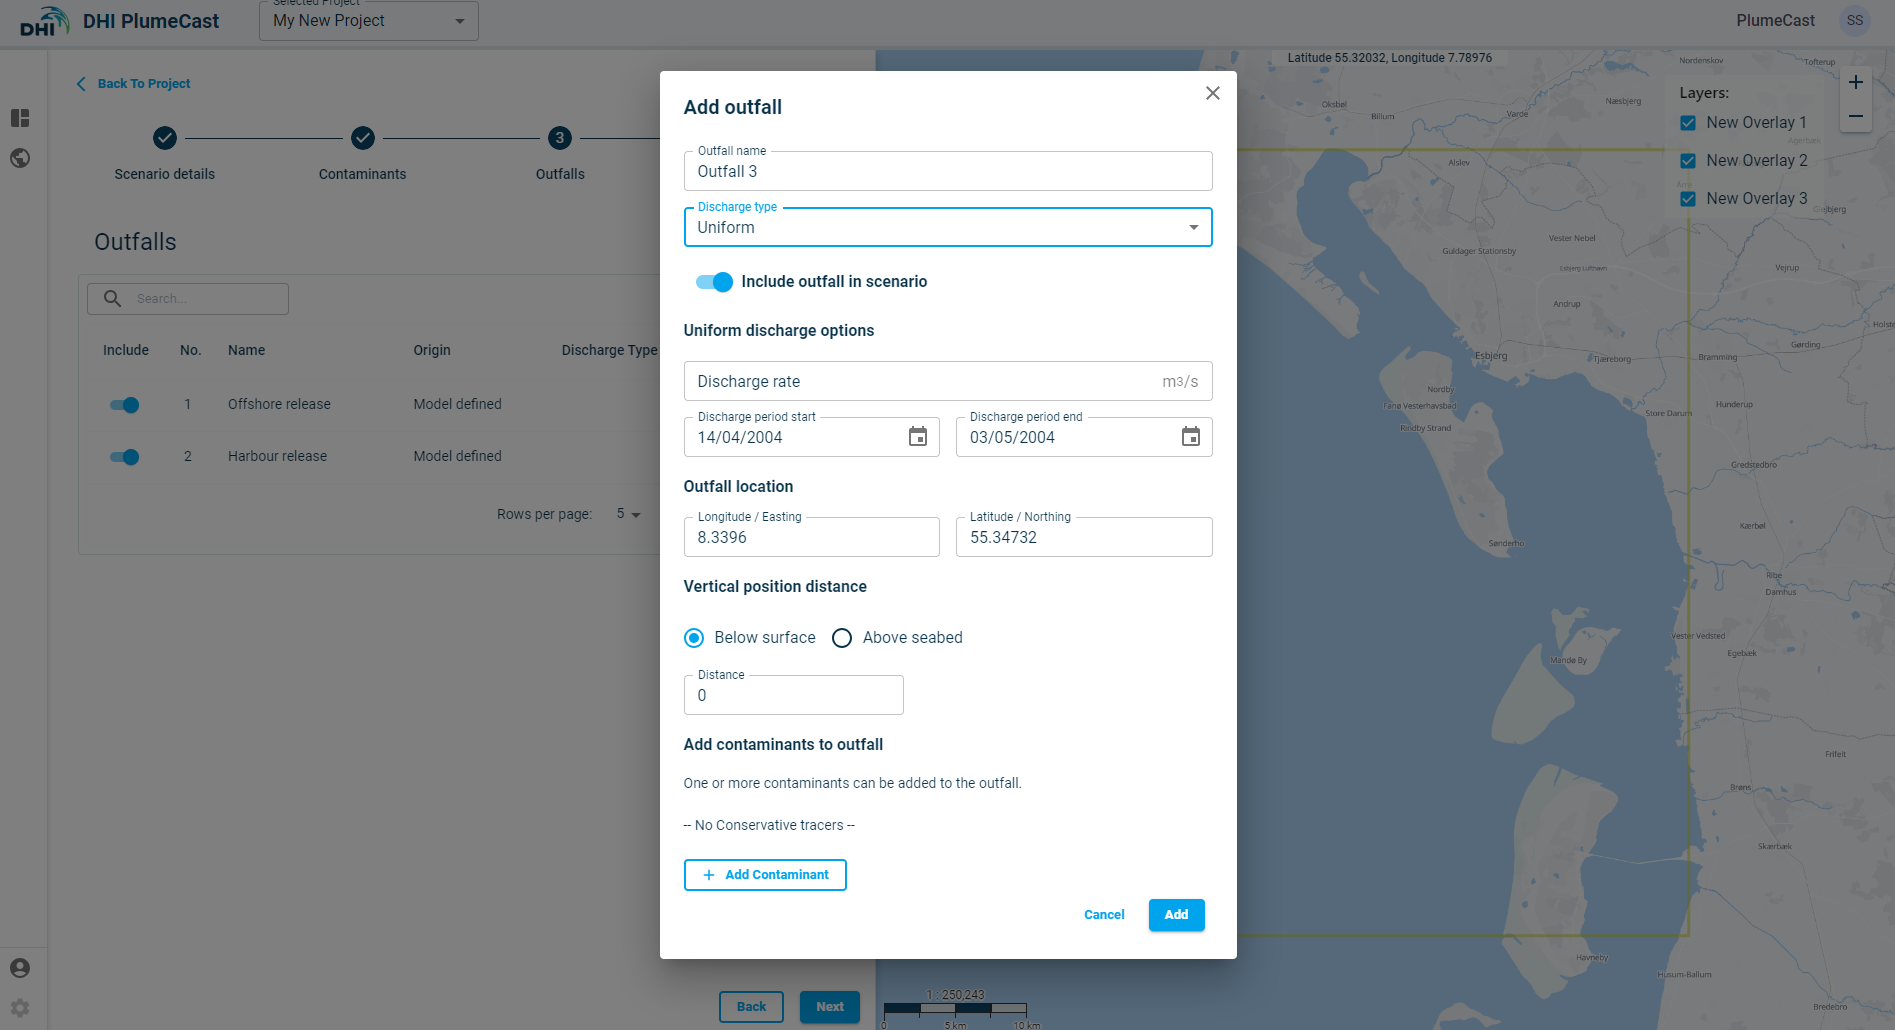
The discharge rate of the outfall can be defined either as ‘Uniform’, where you type in a fixed discharge rate, or upload a dfs0 or a discharge plan in csv format, where you can have a time varying discharge rate.
New outfall Uniform discharge
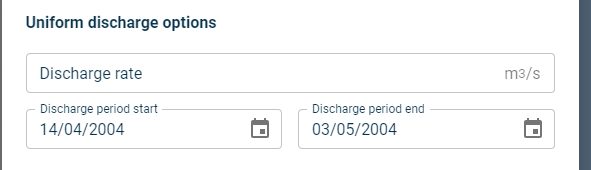
The constant discharge rate must be given in cubic meters per second, and it will be fixed for the entire scenario duration. By default, the uniform discharge is active for the entire scenario duration. You can edit the discharge duration by changing the start and end dates in the calendar fields. Currently, for Uniform discharge you can only assign full days. It is not possible to assign hours for the start and end dates.
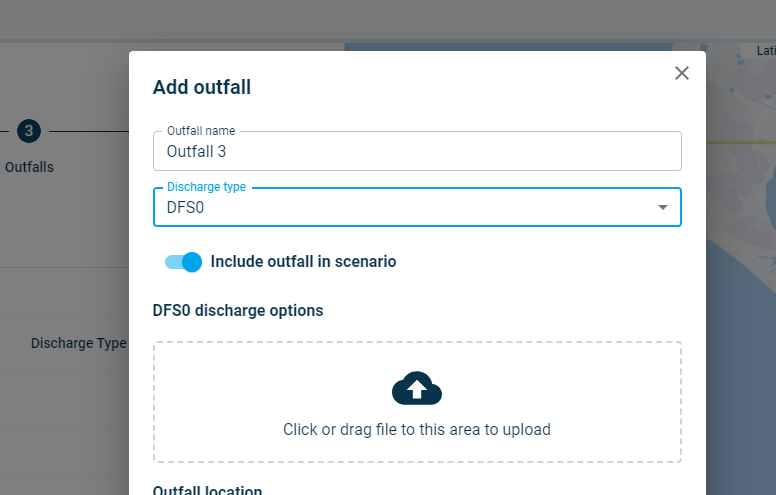
New outfall variable discharge by uploading DFS0 file
If you have prepared your discharge plan in MIKE dfs0 timeseries format, you can directly upload it to DHI PlumeCast for each new outfall you define in your scenario.
As seen below, the dfs0 timeseries file must cover the scenario period, and have the discharge item with units in meter cubic per seconds.
If the dfs0 file is uploaded successfully, you will see a success message and clicking on ‘Add’ in the bottom right will add the file to the list.
Your new outfall (with position type set to ‘dfs0’) will be added to the list of your Outfalls. Currently, it is not possible to see any further information regarding the uploaded dfs0 file after being uploaded.
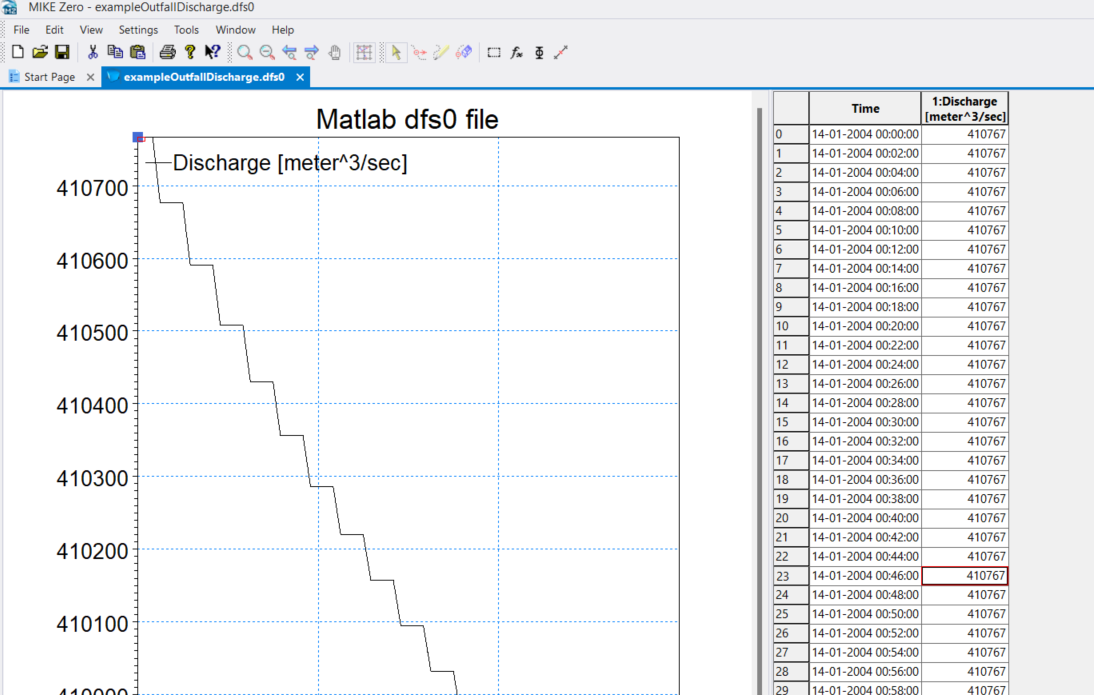
Below you see an example of the dfs0 file. Notice that interpolation will take place between two consecutive rows. If you need to have a sharp start or stop of discharge at any time, you must introduce small time steps before/after the start/stop point, to avoid excess discharge due to interpolation.
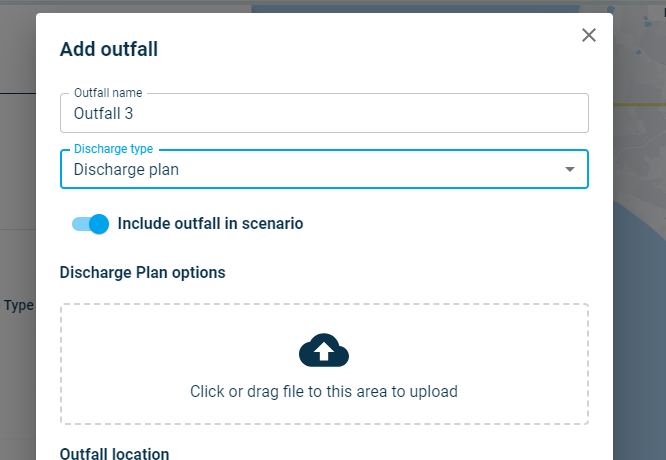
New outfall variable discharge by uploading csv format Discharge plan
If you have prepared your discharge plan in csv format timeseries, you can directly upload it to DHI PlumeCast for each new outfall you define in your scenario. As seen below, the csv timeseries file must cover the scenario period, and have two columns one for date-time and other for the discharge with units in meter cubic per seconds.
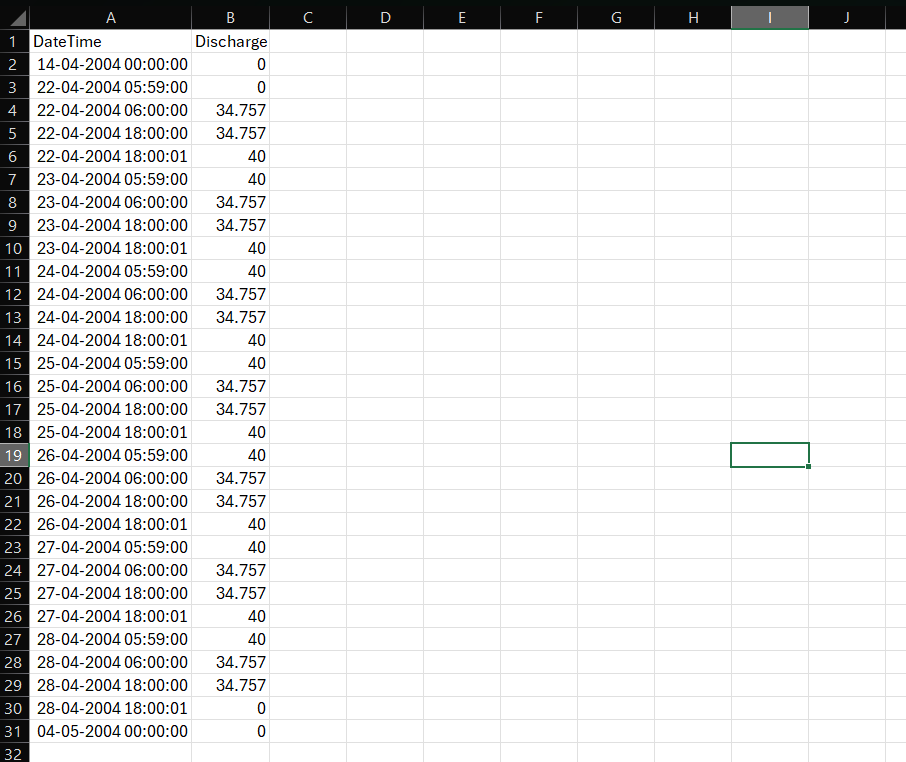
Below you see an example of the csv file. Notice that interpolation will take place between two consecutive rows. If you need to have a sharp start or stop of discharge at any time, you must introduce small time steps before/after the start/stop point, to avoid excess discharge due to interpolation.
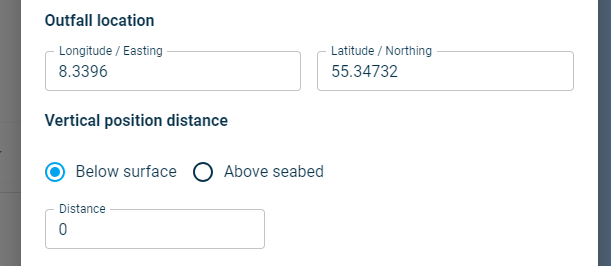
New outfall location
The new outfall’s horizontal location is by default set to the centre of the domain. You can type your desired coordinates (in geographical decimal degrees) into the corresponding boxes for longitude and latitude.
The vertical position of the outfall in water column can be set either as distance ‘Below surface’, or distance ‘Above seabed’. If the domain’s model is a 2-dimensional model, this distance has no impact on model, since all model calculations are depth- averaged.
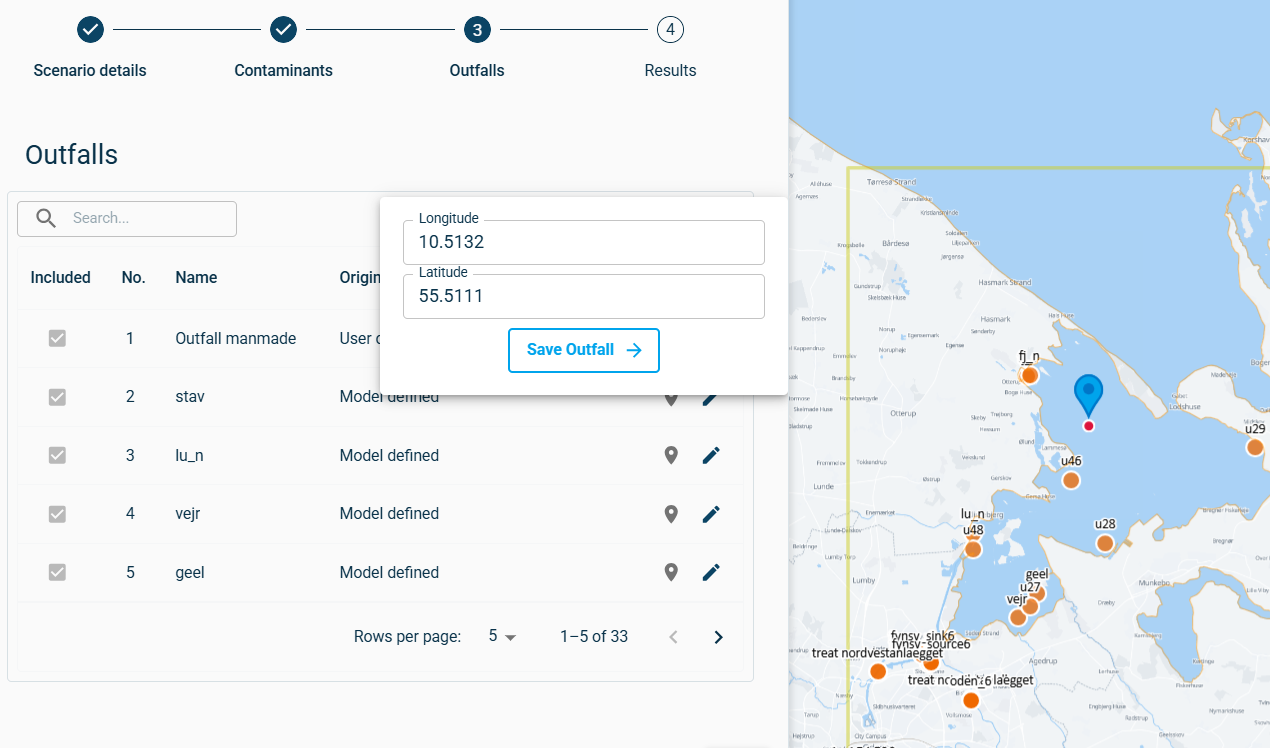
To edit the location of an added outfall, click on the ‘location’ icon ![]() in front of the corresponding outfall, it will open a new window in which you can see the coordinates. You can edit the coordinates by grabbing and moving the point on map until it sits in your desired location or enter the location coordinates.
in front of the corresponding outfall, it will open a new window in which you can see the coordinates. You can edit the coordinates by grabbing and moving the point on map until it sits in your desired location or enter the location coordinates.
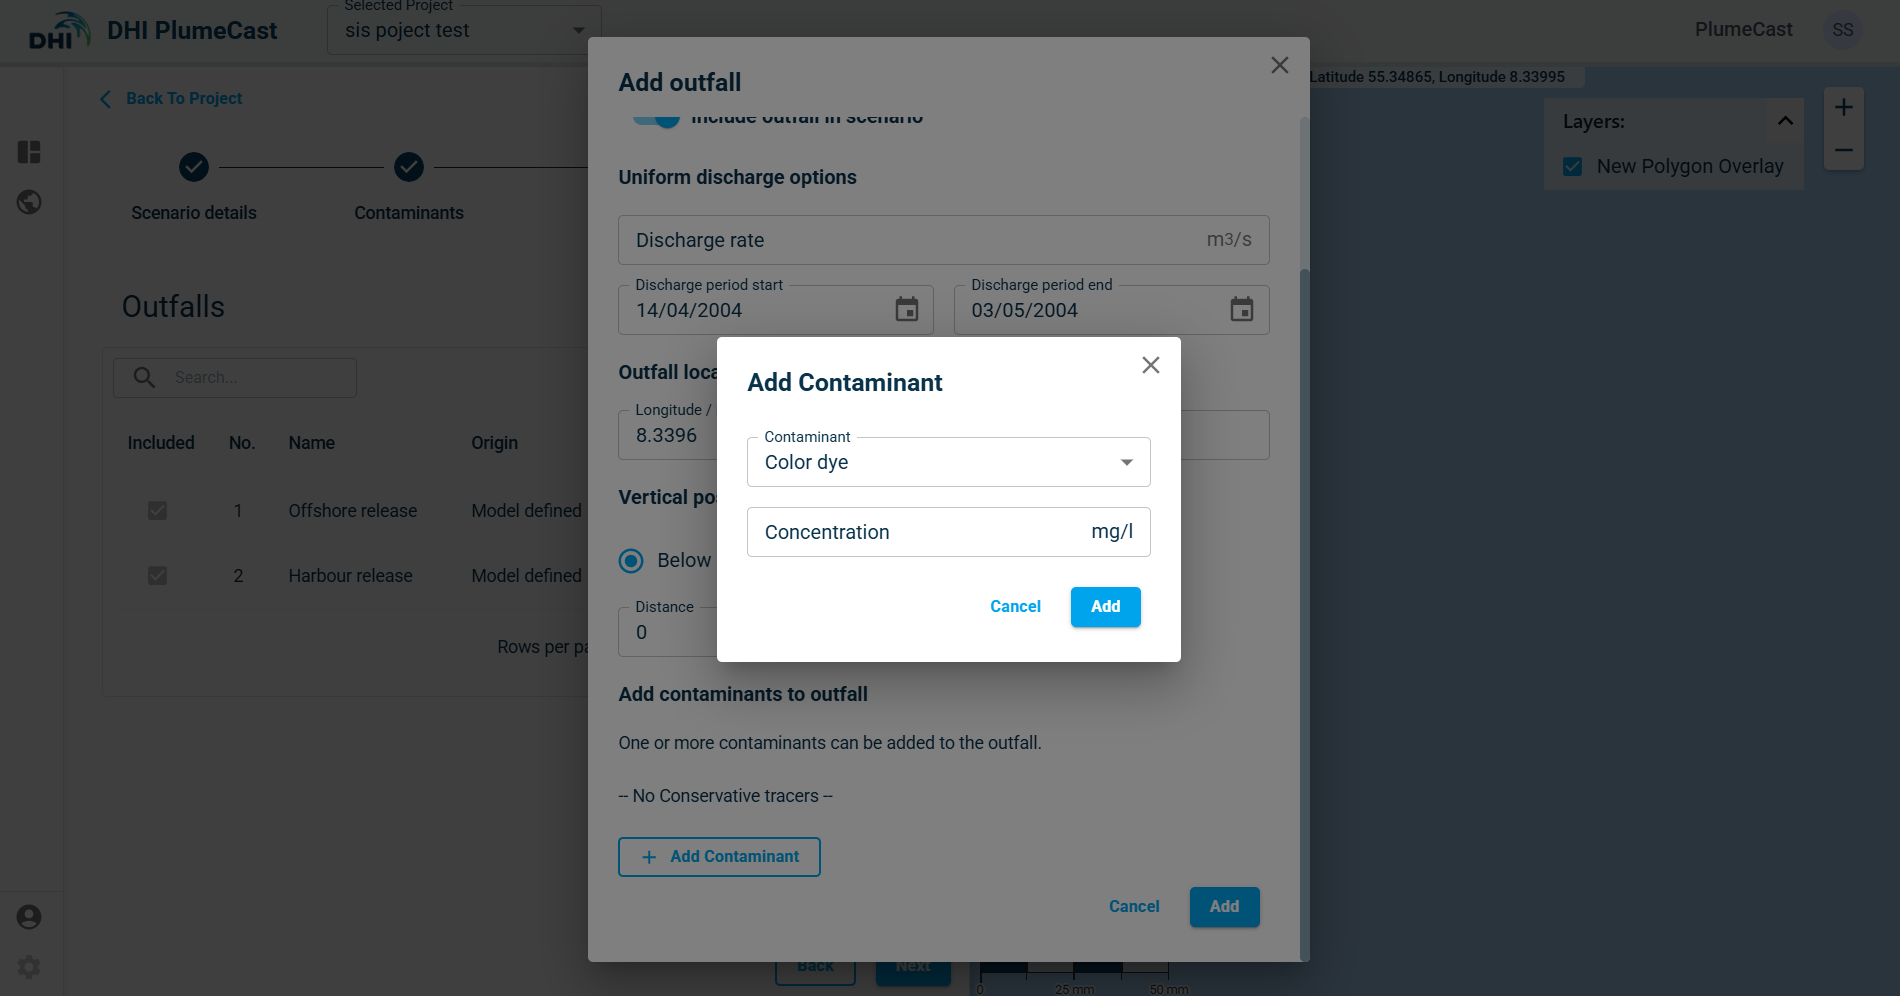
Adding contaminants to new outfall
Like existing outfalls, the user can add the defined contaminants in the previous step to the outfalls with user defined concentration.
Results
In this step you define, adjust the presentation and postprocessing of results of your scenario. You have the following parts:
- Defining the statistical analysis
- Defining timeseries extraction points from results (Monitoring Points)
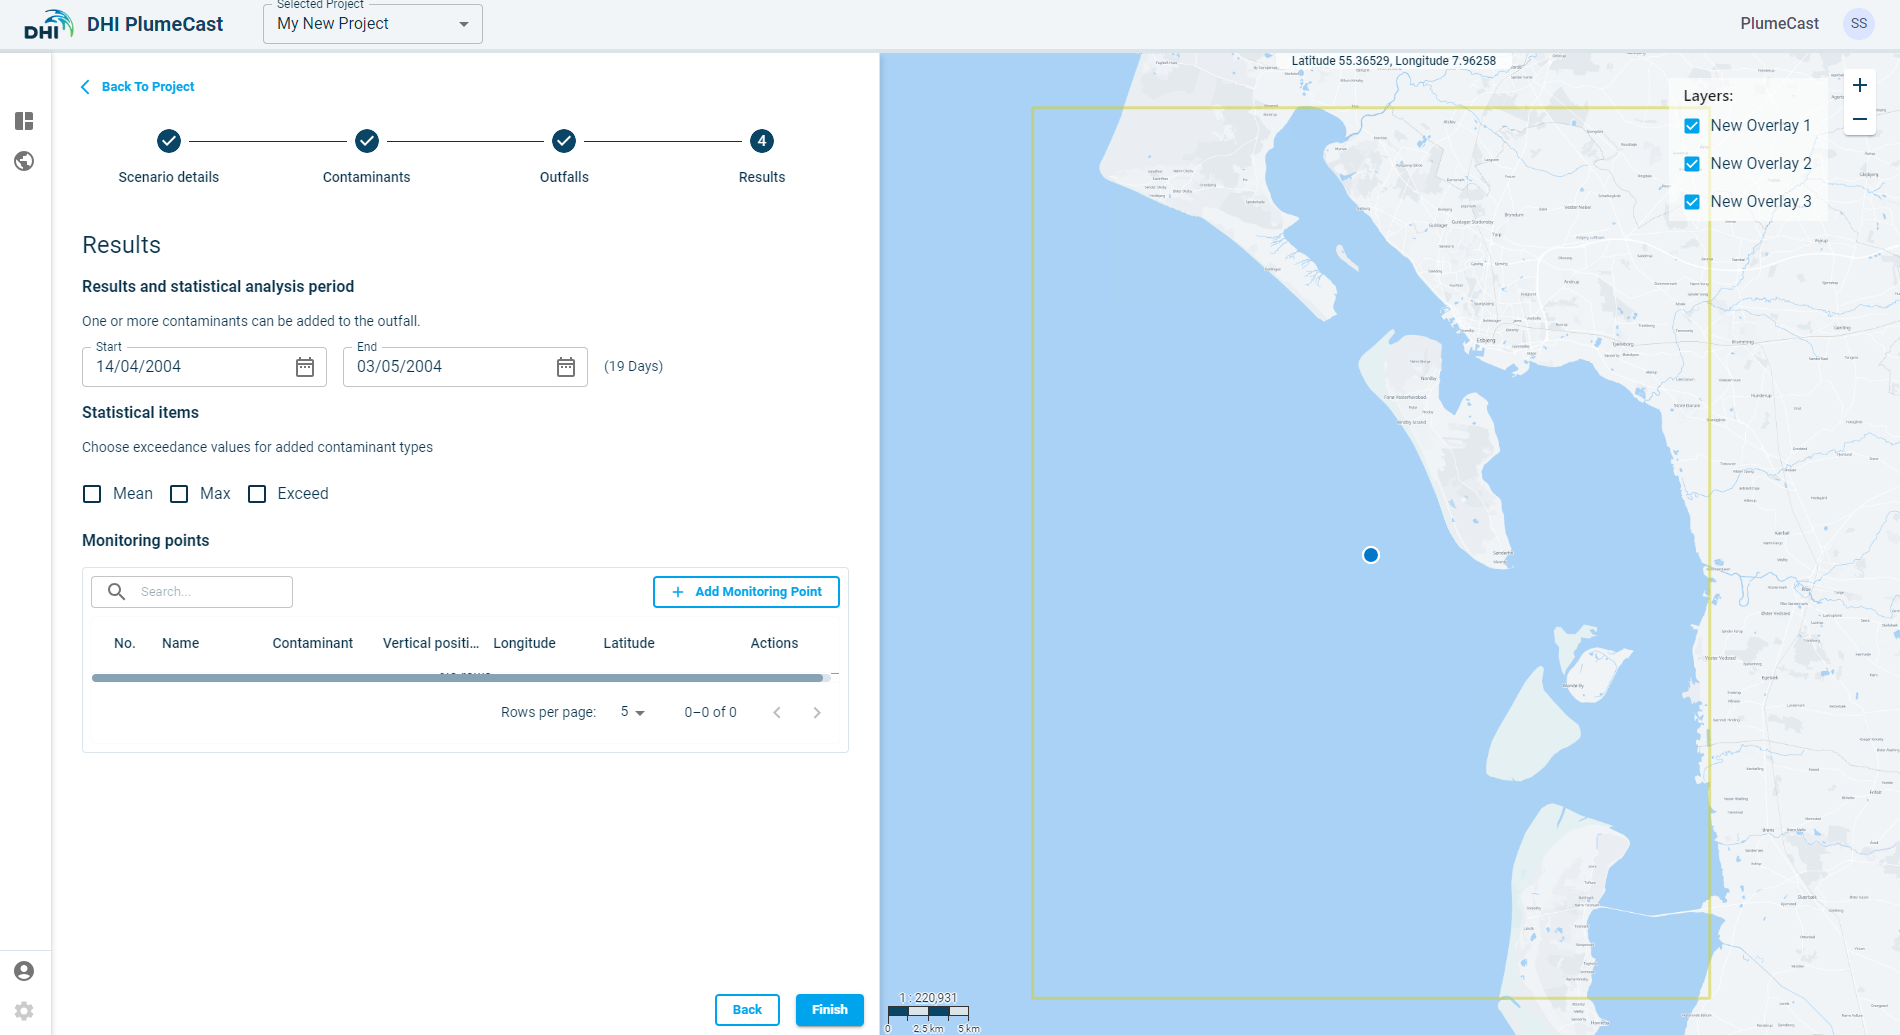
Statistical analysis
You can choose which statistical analysis you want to be done on your scenario results, and within which period. By default, the statistical analysis is done for the entire scenario period, however you have the possibility to do them for a certain period by selecting the start and end date.
By default, we have the following statistical:
-
Mean Concentrations: it calculates the average concentration of the corresponding contaminant in all the domain. You can include it by ticking the box.
-
Maximum Concentration: it calculates the maximum concentration of the corresponding contaminant occurred in all the domain. You can include it by ticking the box.
-
Duration exceeding: It calculates the accumulated duration in which concentrations of the corresponding contaminant have exceeded a certain value. You can add as many exceedance values as you need. You can include this analysis by ticking the box. By default, there are no exceedance values added. You can add more values by typing in the box and removing them by clicking on the X in front of each.
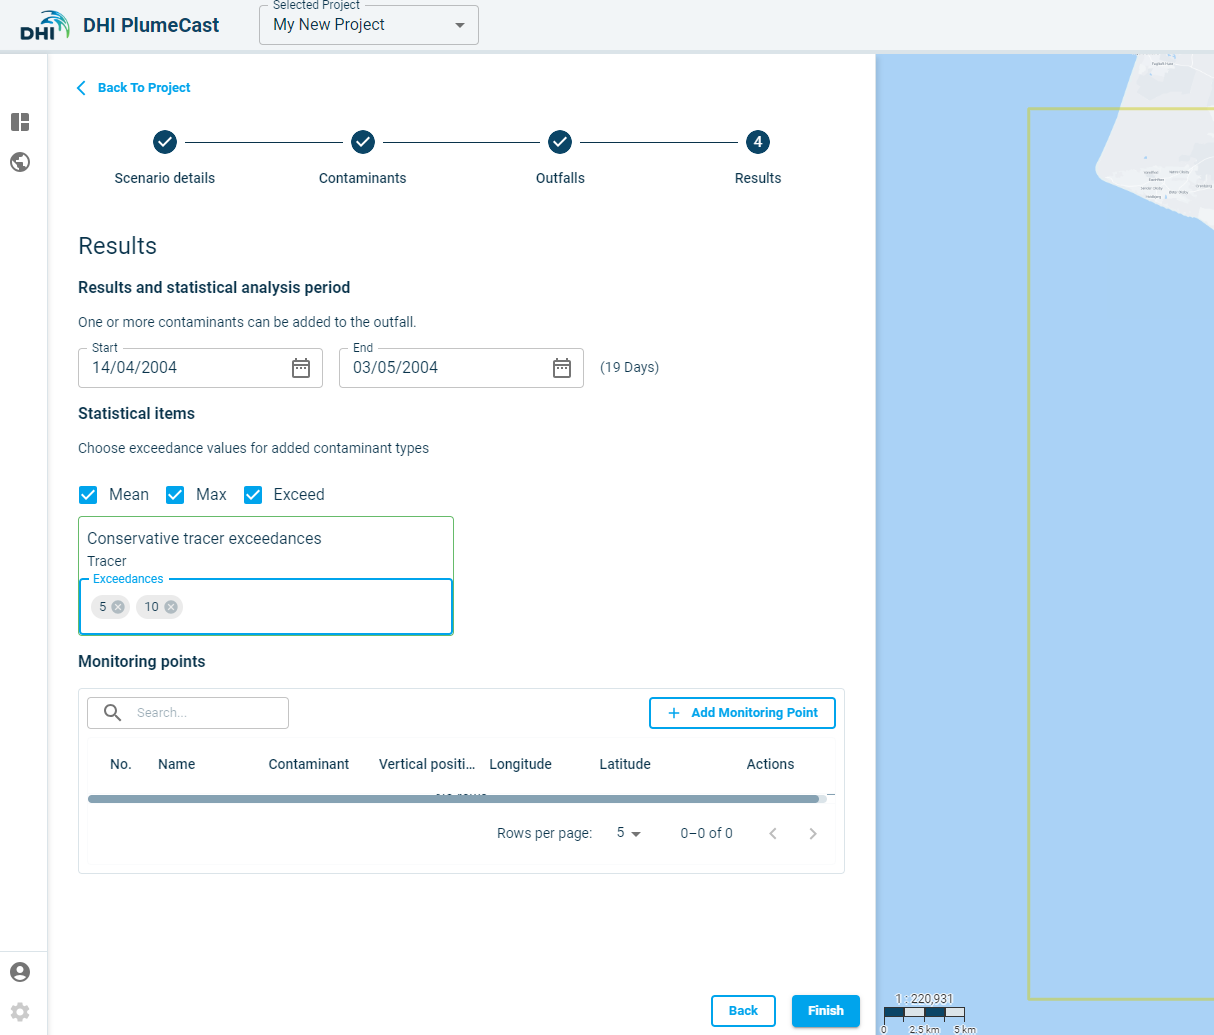
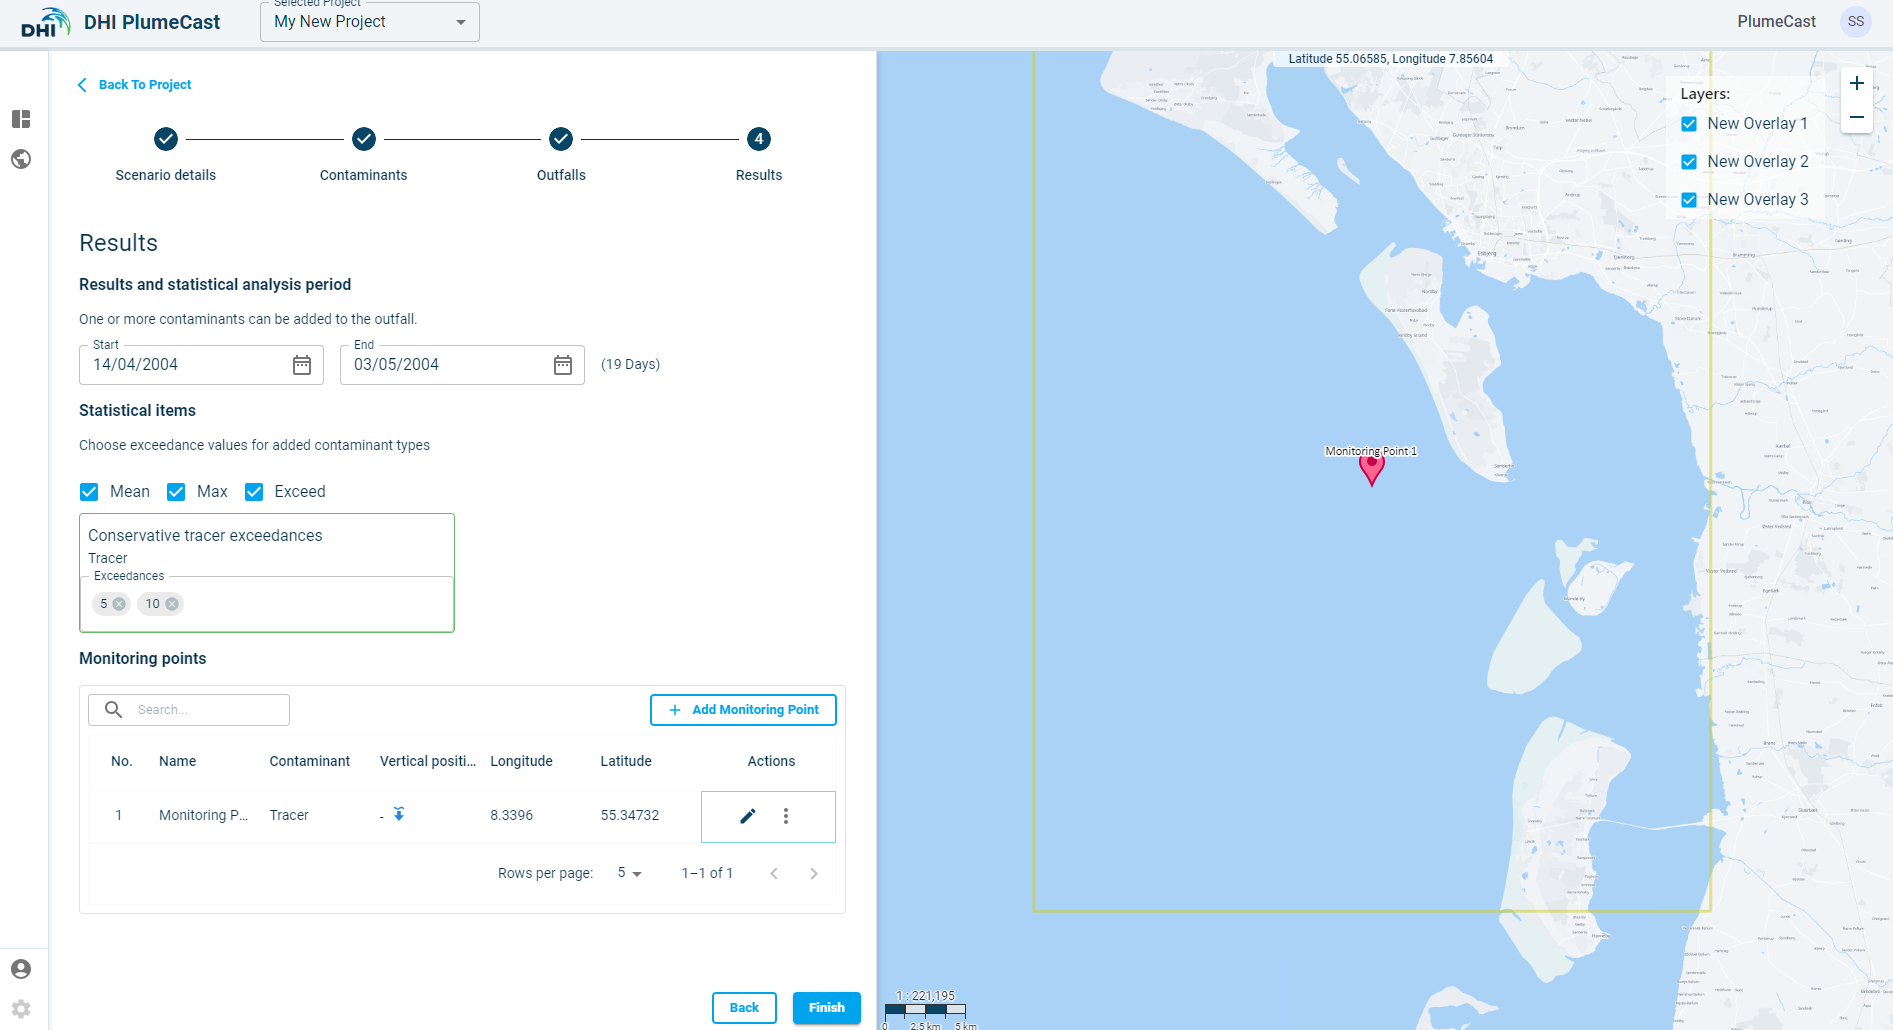
Monitoring Points
In this section you can define points within the domain, to extract from the modelling results, the timeseries of concentrations, or currents speeds and directions.
Click on ‘Add Monitoring Point’. A window opens where you define the new monitoring point characteristics. Its default location will be at the centre of the domain borders.
The default ‘Type’ is ‘Custom’. The ‘Threshold monitoring’ type is only available if you have access to Live Data, and you have defined Threshold points in the Threshold Monitoring section of Project.
You can set the vertical location to extract values from the modelling results, either as Distance ‘Above seabed’ or ‘Below surface’. If the domain’s model is a 2-dimensional model, this distance has no impact on extraction, since all model results are depth averaged.
You can choose what to extract from the modelling results, by choosing either one of the ‘contaminant’ concentration outputs or ‘current speed’.
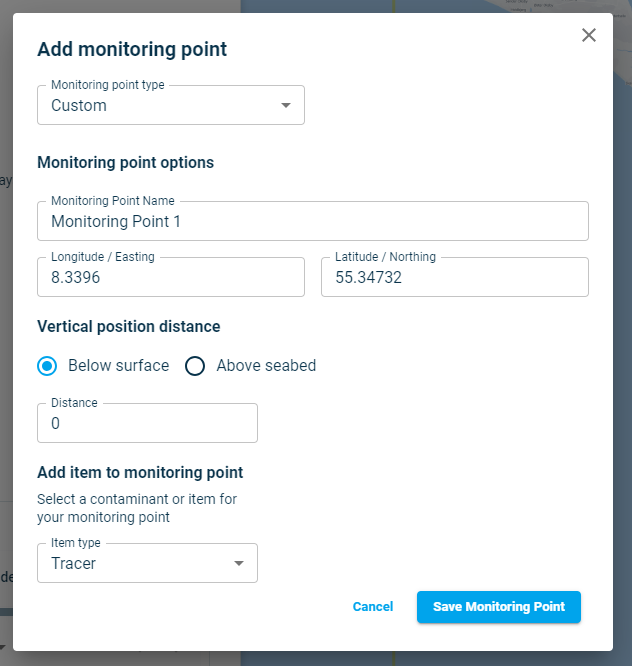
To edit the location of the monitoring point, currently, you can type in the coordinates in the monitoring point’s editing dialogue. Alternatively, you can also It edit by grabbing and moving the point on map until it sits in your desired location.
This is the last step in defining your scenario. After this, you can press on ‘Finish’ which will finalize the scenario definition and direct you back to the project page with scenario overview table.
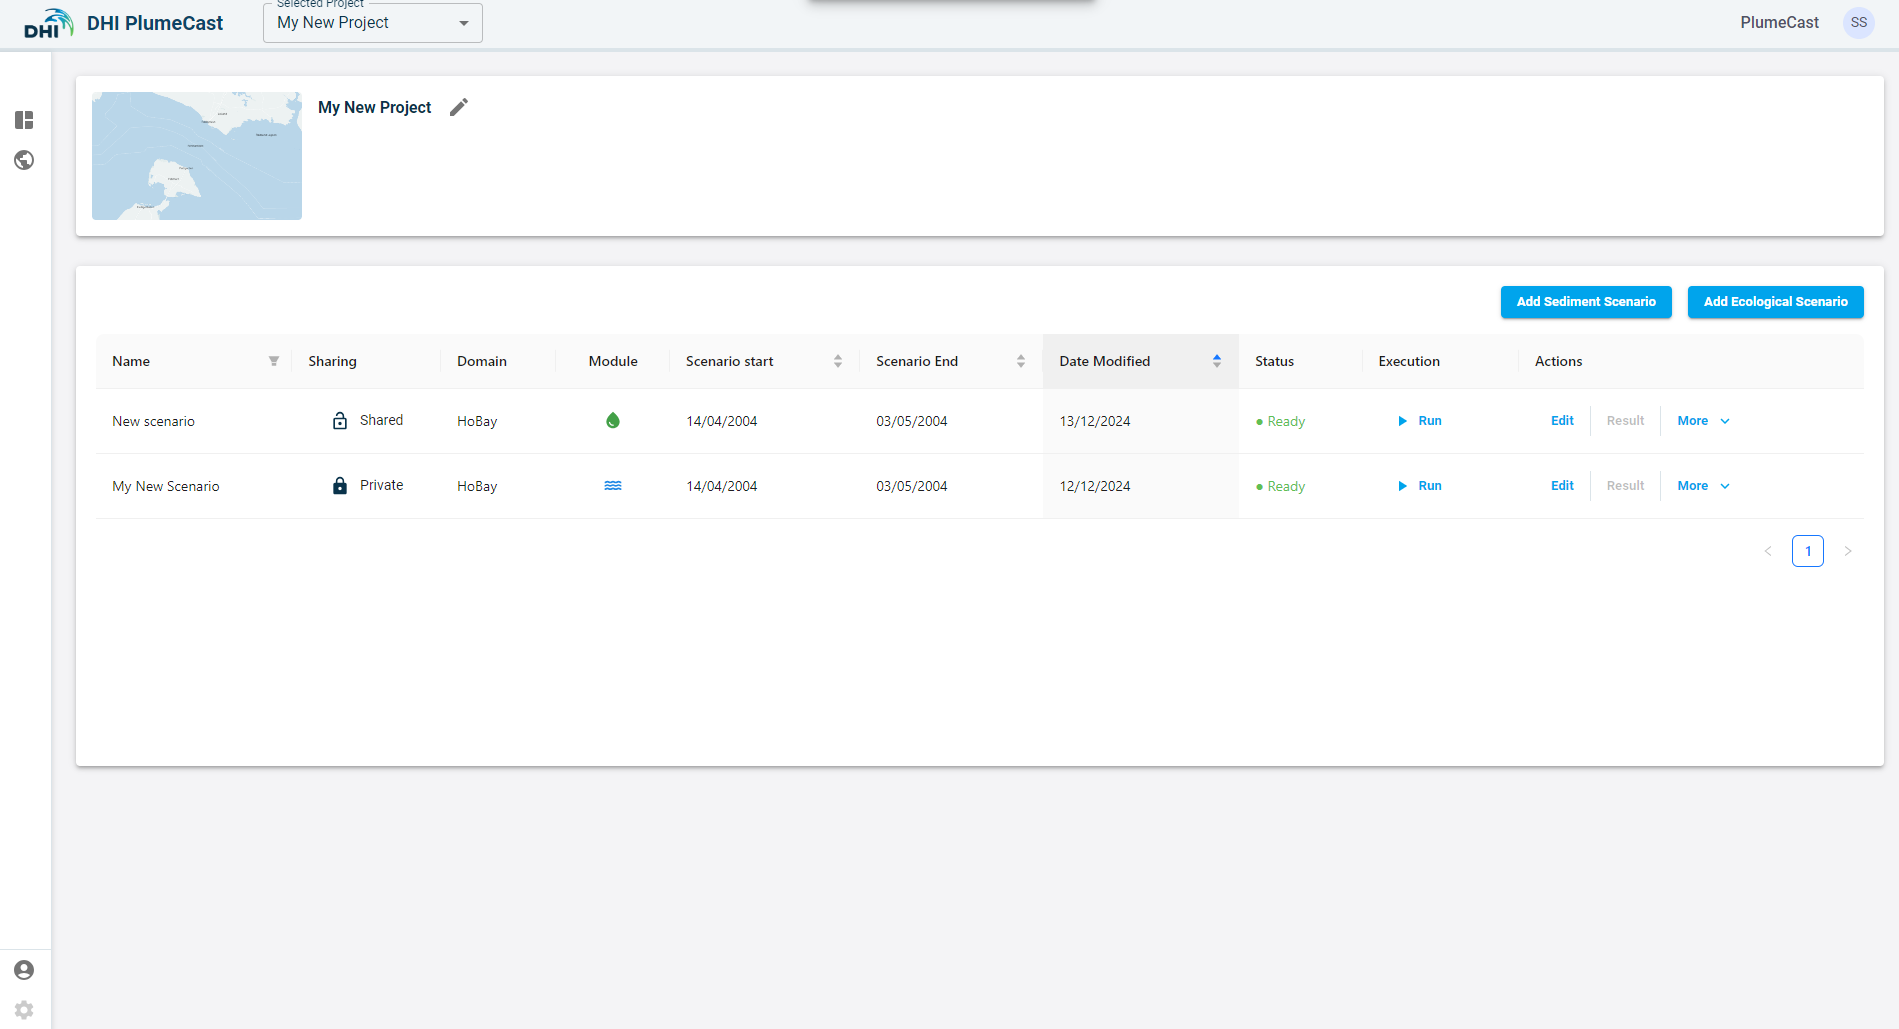
Scenario execution
In the scenario overview list, you can see all the scenarios within your project. When the scenario’s status is ‘Ready’ it means that it is ready to be executed. You can press the ‘Run’ button for the scenario to begin the execution.
After clicking on Run button, the scenario’s status changes to ‘In progress’. It means that the system is now reading your scenario, preparing the model files and eventually executes your scenario in MIKE. When the MIKE simulation starts, you begin to see the percentage of completion as a progress bar in scenario’s status column.
If something goes wrong and scenario execution fails, the scenario status changes to ‘Failed’.
If the scenario execution finishes successfully, the scenario’s status changes to ‘Completed’. In this case, the ‘Results’ button becomes activated, and you can press on it to see the scenario results.