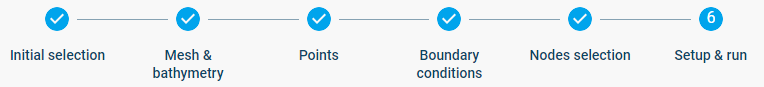
Setup & run
The user can select a default template based on the seabed roughness, as shown in the figure below.
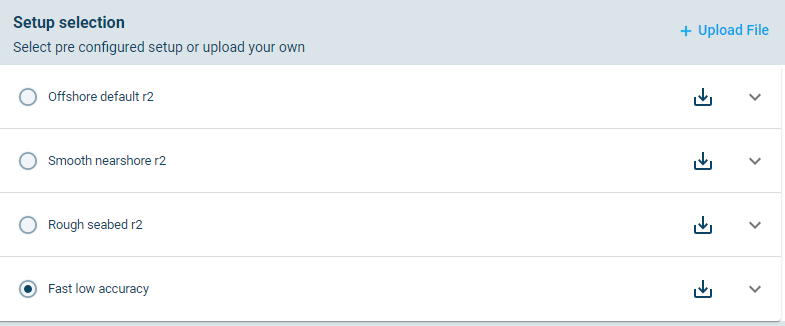
Pre-configured setup templates. More information about the template is available by expanding the accordion button
NOTE: The user also has the option to download ![]() a template to make basic edits in the MIKE 21 SW desktop application and to re-upload
a template to make basic edits in the MIKE 21 SW desktop application and to re-upload  the file as a new template. This can be done if the user wants to adjust the solution technique.
The selected nodes are shown again at the bottom of the inputs panel. In this step the user can select a timestep for conducting a test run by clicking on the chart:

Select Boundary 4 (Offshore) and click the highest wave event on the boundary for running the test.

Selection of a test run
Click the button for running the test.

NOTE: Pay attention to the progress in the Top bar. Running the test will be pending for a minute or two while the computer is prepared in the cloud. Once the computer is prepared, the next simulation will have a shorter pending time.
When completed, the test result will be shown in a panel on the right as a table.

Test run results
Compare the inputs at the Boundary 4 to the results for the point at the boundary. The results should be close to the input values at the boundary.
Table: Comparison of boundary conditions at Boundary 4 to the outputs from the test model run at the same boundary.
| Parameter | Boundary 4 centre | Offshore_point |
|---|---|---|
| Sign. wave height – Wind sea | 16.9 m | 16.7 m |
| Peak wave period – Wind sea | 18.9 s | 18.8 s |
| Mean wave direction – Wind sea | 263 deg | 263 deg |
The test can be repeated to identify whether different templates affect the results at either the boundary, or close to the area of interest.
Test results are also available from the Cloud Admin folder for outputs. The user can navigate to MIKE Cloud admin by expanding the app selector next to the MIKE Metocean Simulator title

In MIKE Cloud Admin, the user must navigate to the output folder. The test results in Cloud Admin is a zip file which includes a spatial output in dfsu format.

It is recommended that the user download and inspect this results file using the desktop MIKE Zero interface. An example of such an output, called Area.dfsu is shown below.

Test run area output
The model runs will take some time to complete. The duration can be estimated by taking the time elapsed to complete the test run and multiplying it by the number of selected nodes. The time elapsed is available in the log file from the sw_testruns.zip file. In this case the test run took 34 seconds to complete, when using the “Fast low accuracy”. The “Offshore default r2” template took about the same time and the results is not changed significantly in this case.
In this example, the total simulation is expected to take about 1h to complete running 100 nodes. Some additional time for timeseries reconstruction will also be required after the nodes have been simulated.
WARNING: There is a wall time of 24h on the model simulations. If the total simulation time is at risk of reaching 24h, the user should reconsider the mesh density, the number of nodes or the model template settings.
Press Run model to run the full set of simulations.
A pop up message will notify the user of any information related to the consumption of cloud credits, as shown in figure below.

Notification at start of cloud execution.
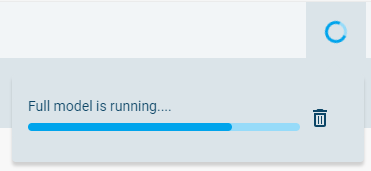
The user can now click “Run model”. The user will soon see a progress notification in the top bar:
On completion a notification pops up, as shown below, indicating that the model results is ready for download or for publishing to MOOD.
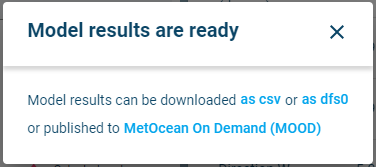
Pop up notification indicating that the model results are ready. The pop us includes options to download data or to publish the results to MOOD.
The user can also log out of the browser and return sometime later to follow up on the model runs. In such case the notification in the figure above will not be shown. Instead the user can see from the footer that the model results have been completed (on 22 Oct 2024 11:16:09 AM), as shown in figure below.
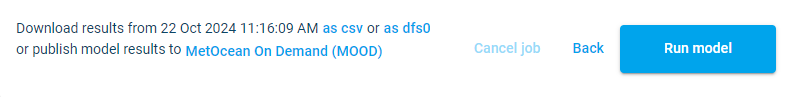
Footer which shown the last time that model runs have been completed.
When the simulation has completed, results can also be downloaded directly from the Setup & run tab by clicking the “as csv” or “as dfs0” text: 
The results are also available from the project’s outputs folder in MIKE Cloud Admin.
The results can be published to MetOcean On Demand (MOOD) by clicking the provided button. The MIKE MS results will be called a Local Model in MOOD.