MIKE Metocean Simulator Release Note (16 December 2025)
Release version 1.14
The highlight of this release is a set of improvements for viewing results, both from test runs and full model runs. For users with MOOD subscriptions, it's now possible to view MOOD wave model meshes in the Boundary Conditions tab.
Results viewing improvements: Test runs
After a test run, it's possible to view two-dimensional results. To create a result map, click the button, "Create map layer".

After the map layer has been created, click on "Go to map" to view 2D results. Result items can be selected from a drop-down menu.

It's possible to view older test runs using a new selection menu.

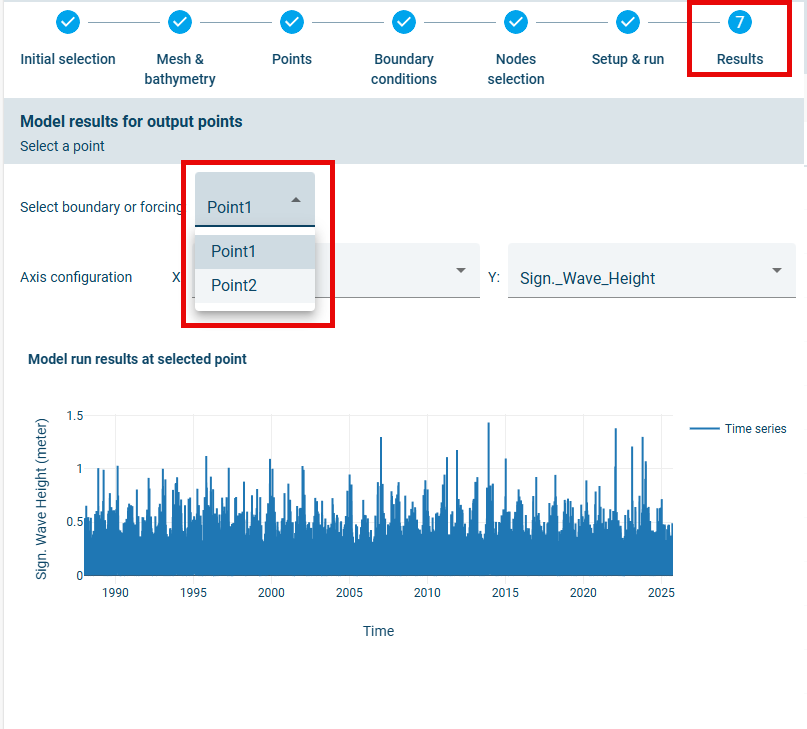
Results viewing improvements: Full model runs
Two-dimensional results are not yet available for full model runs. However, it's now possible to view time series plot for user-defined points on a new Results tab.
The right-hand pane of the Results tab is the same as for the Setup & run tab. In other words, this pane displays results from test runs.
MOOD wave model meshes
MOOD subscribers have access to a number of MOOD data sets when creating boundary conditions. These include outputs from regional wave models run by DHI.
Computational grids for these regional wave models are now available for preview when selecting boundary condition data sets. The display is synced with the selected wave model data set. To change display settings, expand "Spatial coverage of wave data providers" under "Layers".

A summary of all features included in this release is given below:
Features
- Results viewing improvements: Two-dimensional maps of test model results now available. In addition, it's possible to view results of older test runs and time series results from full model runs.
- Handling of NaN values for dry elements: A nearshore model element located in shallow depths can dry out. This results in missing value outputs from MIKE 21SW. When missing values are returned by MIKE 21SW, these values are assumed to equal zero when reconstructing time series.
- Preview of regional wave models: Computational grids for these regional wave models are now available for preview when selecting boundary condition data sets.